2026-10-06 · 17 min · datasets · data-provenance · licensing · privacy · developer-tools
Why read this
Notabletop 60%Reads all 148 Parquet footers of a 460 GB TikTok scrape: real row count, what a query downloads, where pruning fails, a timestamp bug, and the GDPR problem.
- Original, source-checked analysis
- Runs on a laptop CPU
- Concrete numbers to act on
Data & datasetsCC-BY-NC-4.0Practitioner dataset
How this was scored
- Is it new?
- 0 of 3: Repackaging or news of a known thing
- Can I trust it?
- 3 of 3: Reproduces the headline result, or shows from primary files it is wrong
- Can I run it?
- 2 of 3: Open code or weights with real limits
- Will I understand it?
- 2 of 3: Mechanism from first principles with figures
- Can I act on it?
- 2 of 3: A concrete recipe, numbers or comparison
- Will it last?
- 1 of 3: Relevant for months
- Does it affect many?
- 1 of 3: A specialist community
- Only here?
- 3 of 3: The only place this analysis exists
Score 64 of 100, ranked 176 of 445 rated articles. Each question is answered 0–3 by hand, and a 3 is rare. How articles are scored
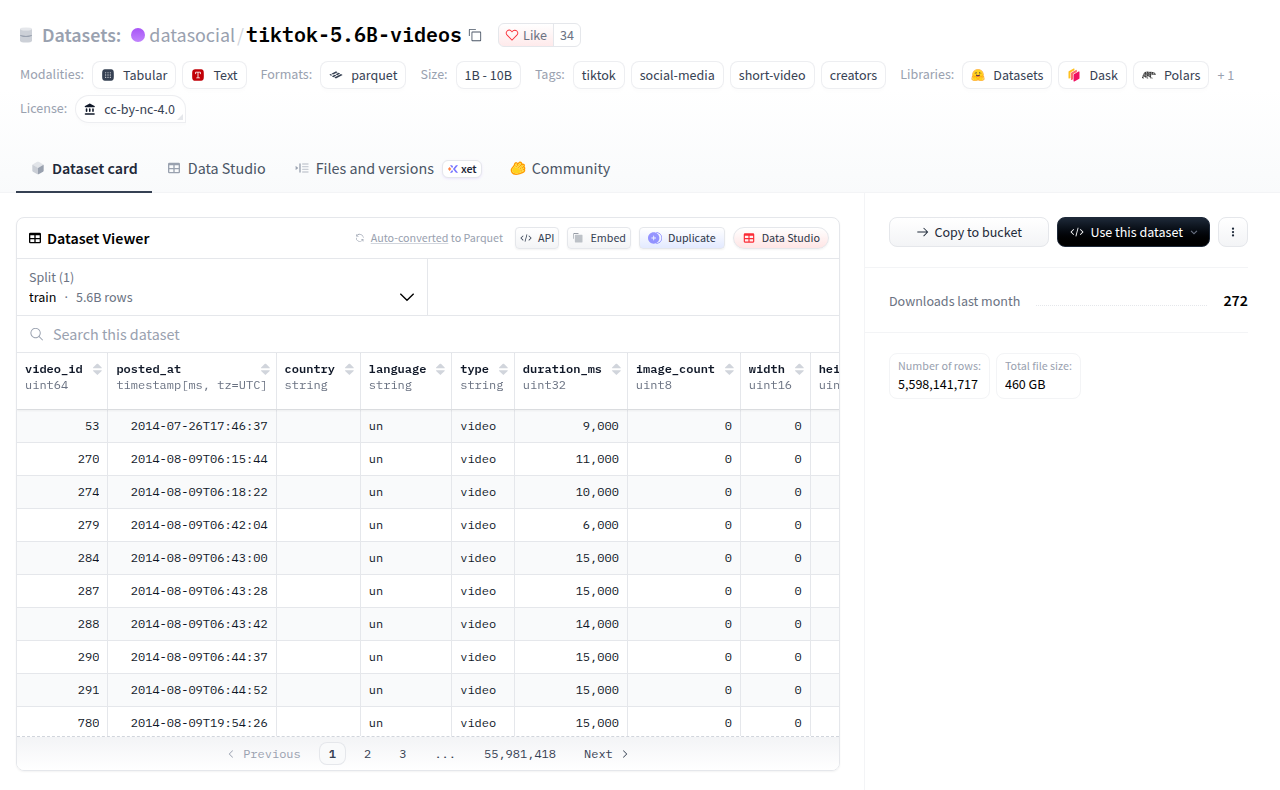
A Japanese post on X went around on 6 October summarising a new Hugging Face dataset, datasocial/tiktok-5.6B-videos: metadata for 5,597,462,038 public TikTok videos from 2014 to a snapshot dated 2026-10-03, in one Parquet file per month, with captions, hashtags, sounds, TikTok Shop links and engagement counts. The post's author says in their own bio that their posts are mostly news an AI has organised and that they have not touched or verified the contents. That makes the dataset card the primary source. The card's numbers are checkable, so I checked them.
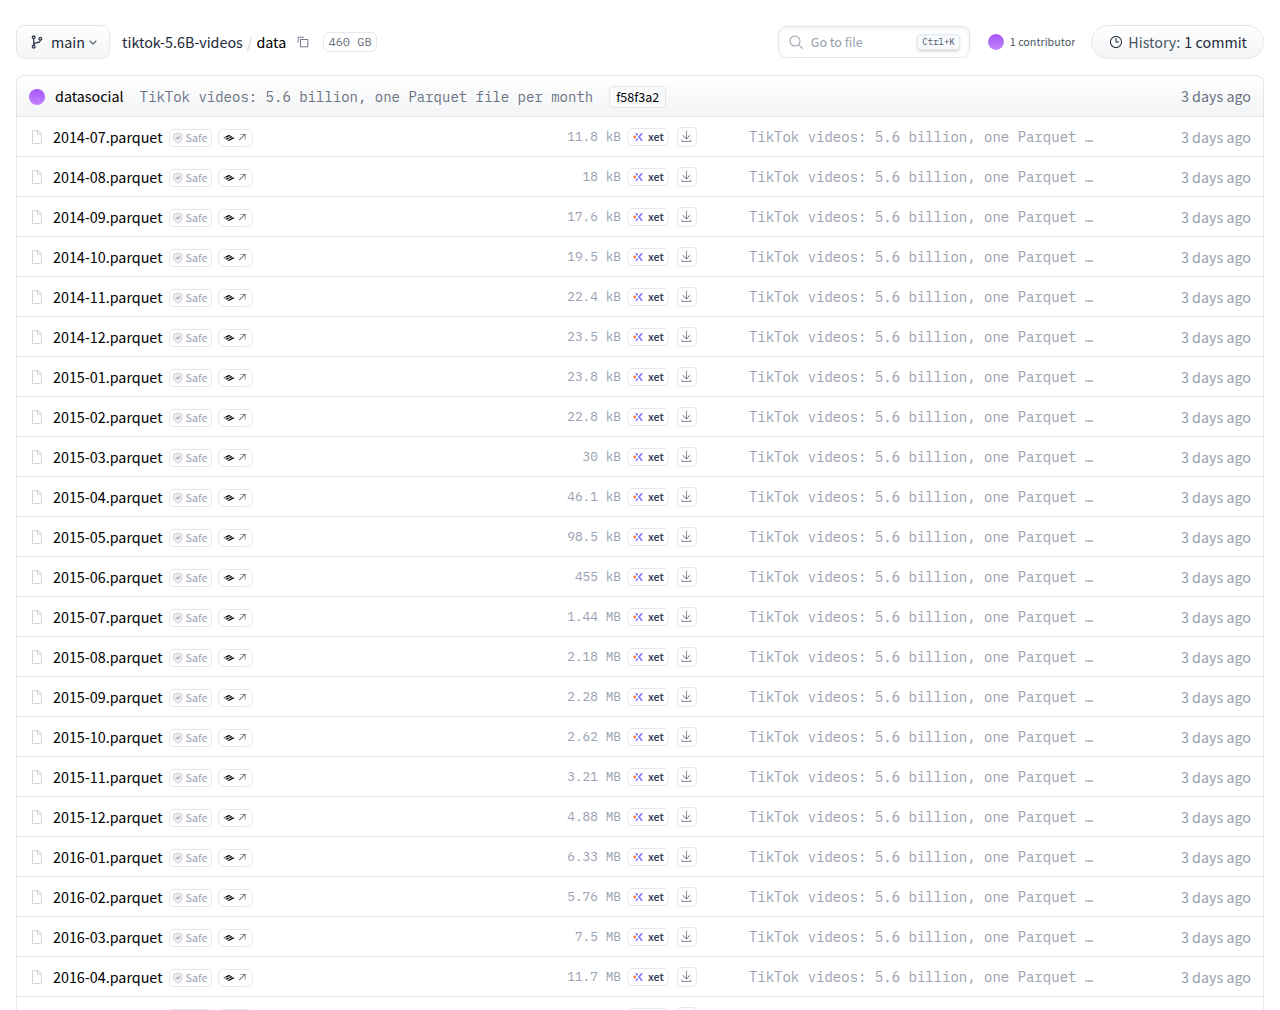
The whole dataset is 460,480,288,988 bytes. I did not download it. A Parquet file keeps a self-describing index at its end, so I read all 148 indexes with HTTP range requests and downloaded one 191 MB file to run real queries. Each number below is labelled: measured (I computed it from a file or a run), reported (the publisher's figure, not re-run), or reasoned (my arithmetic on the other two).
Why a 460 GB dataset fits through a laptop
Three properties of the files do the work. Each is visible in the footers.
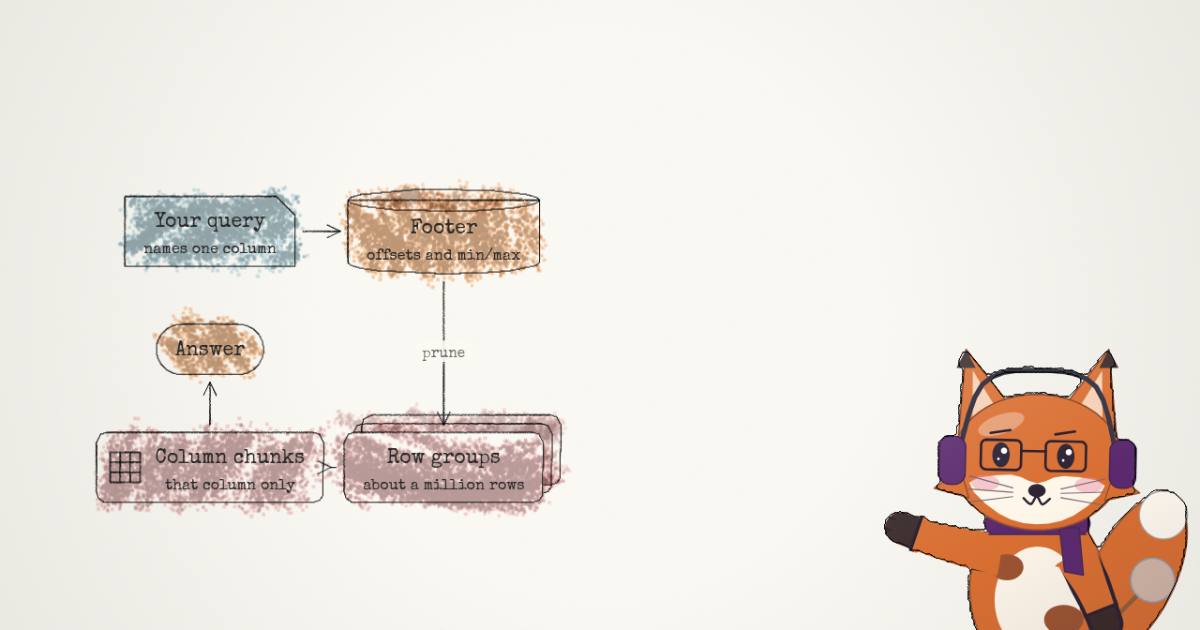
Columnar storage. A Parquet file is cut into row groups, horizontal slices of rows. Inside each row group, every column is stored as its own contiguous column chunk, compressed on its own. A query that needs views reads the views chunks and nothing else. Row-oriented storage has to read every field of every row it touches.
The footer is an index. The last 8 bytes of a Parquet file are a 4-byte little-endian length and the magic PAR1. The bytes before them are a Thrift-encoded FileMetaData: the schema, and for every row group and every column chunk its byte offset, compressed size, codec, value count and min/max statistics. A reader fetches the tail, then the footer, and then knows exactly which byte ranges it needs. It never has to see the rest.
HTTP range requests. Hugging Face serves dataset files with Accept-Ranges, so Range: bytes=-8 returns the last eight bytes of a 10.95 GB file and nothing more. That is all DuckDB's httpfs extension needs to treat a remote file like a local one. It issues one GET per byte range it wants.
I wrote a short Python reader for the footer. It is a minimal decoder for Thrift's compact protocol: varints, zigzag integers, field-id deltas and nested structs. It fetches every footer the same way:
# pq.py: read a Parquet footer over HTTP without downloading the file
import struct, urllib.request
BASE = "https://huggingface.co/datasets/datasocial/tiktok-5.6B-videos/resolve/main/"

def rng(path, spec):
    req = urllib.request.Request(BASE + path, headers={"Range": f"bytes={spec}"})
    return urllib.request.urlopen(req, timeout=120).read()

def footer_bytes(path):
    tail = rng(path, "-8")                      # 4-byte length + b"PAR1"
    n = struct.unpack("<i", tail[:4])[0]
    assert tail[4:] == b"PAR1"
    return rng(path, f"-{n + 8}")[:n]           # Thrift compact FileMetaData
Reading all 148 footers moved 21.8 MB, which is 0.005% of the dataset (measured).
What the footers say
Row count. Summing num_rows over the 148 footers gives 5,598,141,717 (measured). The card says 5,597,462,038 (reported). The files hold 679,679 more rows than the card, about 0.01% (reasoned). The Hub's dataset viewer shows the same 5,598,141,717, presumably because it reads the same metadata. In the one file I loaded fully, every video_id was distinct, so the gap is not duplicates there. The card does not say how it counted. My guess is that the headline was written before the last partial month was refreshed, but I cannot check that.
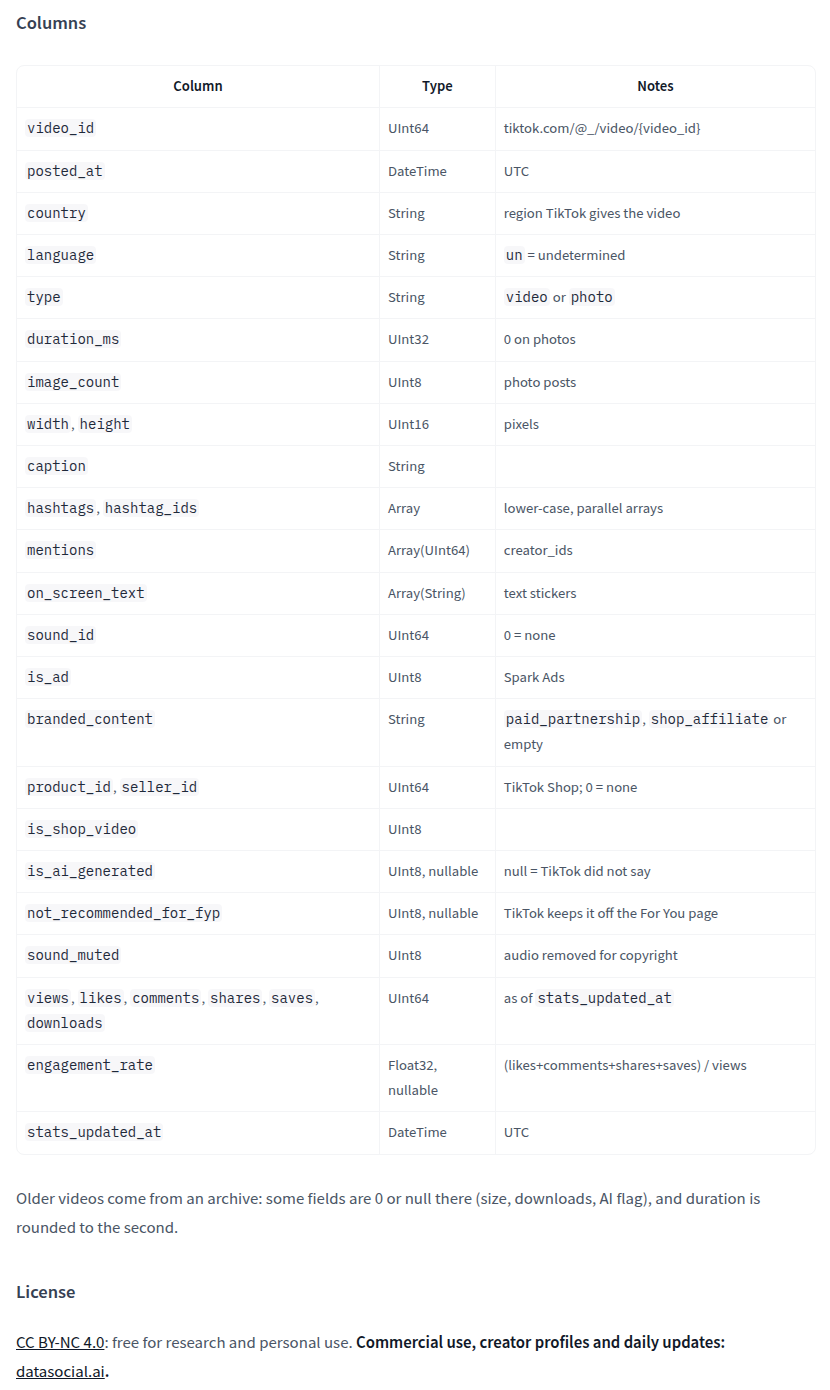
The writer. Every file reports created_by as ClickHouse 26.8.2. Every column chunk is ZSTD-compressed. There are 5,508 row groups in total, and a full row group holds 1,046,544 rows (measured). The column data is 927.95 GB uncompressed and 421.80 GB compressed, a 2.20x ratio (measured, reasoned).
Where the other 38.7 GB goes. The column chunks add up to 421.80 GB, but the files add up to 460.48 GB. The difference is bloom filters: ClickHouse writes a split-block bloom filter for every column chunk, 38.59 GB in all, or 8.4% of the bytes (measured). The column and offset page indexes add another 52 MB. The video_id bloom filters alone take 11.35 GB. They exist so that a lookup such as WHERE video_id = … can rule out a row group without reading it. Min/max statistics cannot do that here, because each row group's IDs span the whole month.
Where the bytes are. Text dominates. Across all 148 files, the compressed bytes by column are (measured):
| column | compressed | share |
|---|---|---|
caption | 173.95 GB | 41.2% |
hashtags | 68.59 GB | 16.3% |
on_screen_text | 39.49 GB | 9.4% |
sound_id | 30.71 GB | 7.3% |
video_id | 21.25 GB | 5.0% |
views | 10.09 GB | 2.4% |
posted_at | 3.10 GB | 0.7% |
| 24 other columns | 74.62 GB | 17.7% |
So the cost of a query depends almost entirely on whether it touches text. A count of views over all twelve years reads 2.2% of the bytes. A caption search over one year reads 38% of that year's files (reasoned, from the footers).
Videos per month, measured
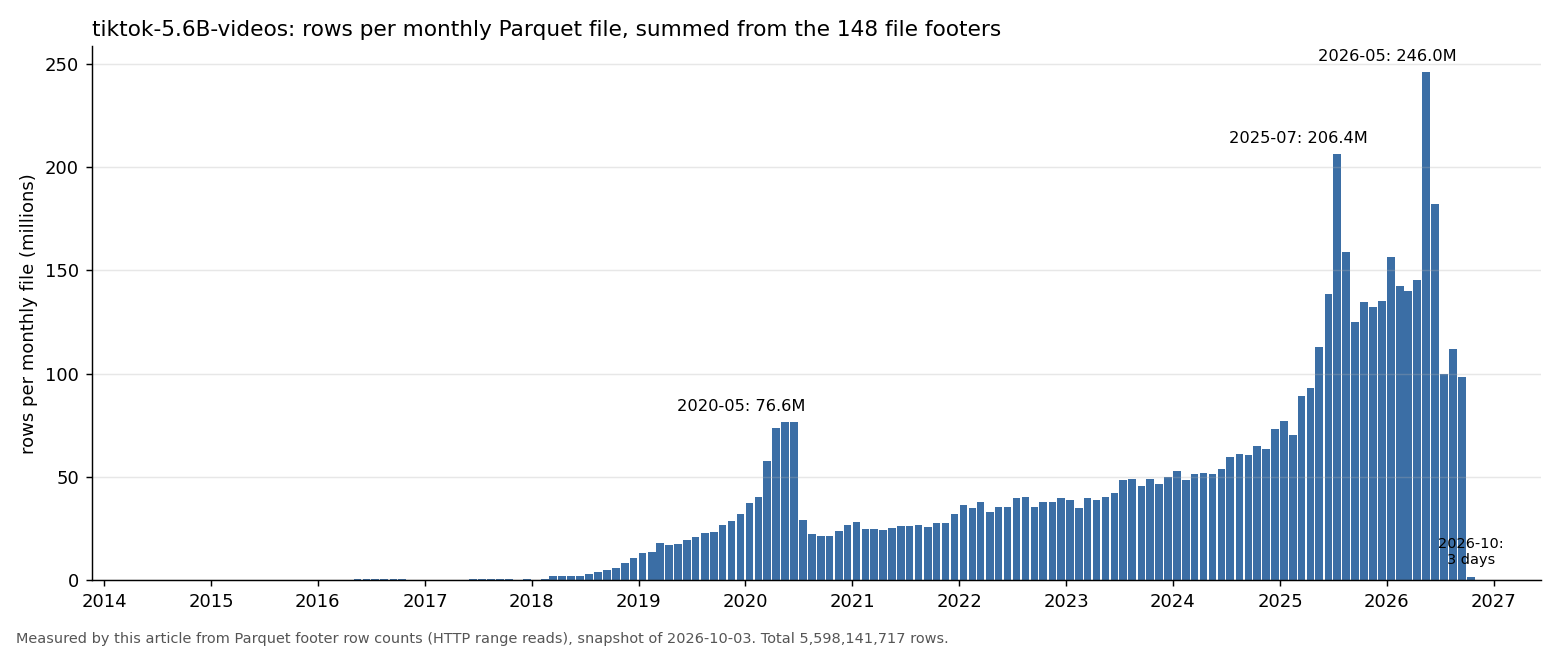
Treat the chart as a picture of the crawl, not of TikTok. The shape has steps a platform does not take:
- June 2020 holds 76,640,830 rows and July 2020 holds 29,023,696, a 62% drop in one month (measured, reasoned). Nothing that large happened to TikTok uploads that month.
- July 2025 holds 206,395,121 rows and May 2026 holds 246,042,234, each well above the months on either side (measured).
- July to September 2026 sit near 100 million each, after 181,883,857 in June (measured).
Coverage that moves this much from month to month is a property of whoever ran the crawler. A trend line drawn over these counts measures the crawler. The early files tell the same story. 2014-07 is one row. The 2014-08 file has video_id values from 270 to 12,938. Rows dated 2016 have IDs around 1.0e17. These do not decode as TikTok's 64-bit IDs, whose top 32 bits are a Unix timestamp. In the 2018-09 file, the smallest ID decodes to 2018-08-31 23:59:59. In the earlier files I checked (2014-08, 2016-06, 2017-12 and 2018-03), the smallest IDs do not decode to any date in their own month (measured from the footer min/max statistics). TikTok absorbed musical.ly in August 2018, which fits the card's note that "older videos come from an archive". The card does not say which archive.
Querying it: the real numbers
DuckDB reads hf:// paths directly, so the card's example runs as written:
-- the card's example: top hashtags in September 2026
SELECT hashtag, count(*) AS videos
FROM (SELECT unnest(hashtags) AS hashtag
      FROM 'hf://datasets/datasocial/tiktok-5.6B-videos/data/2026-09.parquet')
GROUP BY hashtag ORDER BY videos DESC LIMIT 20;
To see what a query costs, EXPLAIN ANALYZE in DuckDB 1.5.6 prints the HTTP traffic. I ran the cheapest useful query against the September 2026 file, which is 10,951,002,399 bytes:
EXPLAIN ANALYZE
SELECT count(*), sum(views)
FROM 'https://huggingface.co/datasets/datasocial/tiktok-5.6B-videos/resolve/main/data/2026-09.parquet';
-- HTTPFS HTTP Stats: in: 184.7 MiB  #HEAD: 1  #GET: 98
-- 98,594,752 rows   Total Time: 26.71s
The footers predict that cost before the query runs. The views column chunks in that file total 184.14 MiB. Add the 0.36 MiB footer and the prediction is 184.5 MiB. DuckDB fetched 184.7 MiB (measured), in 98 GETs for a file with 96 row groups. The query read 1.77% of the file. It ran at about 7.3 MB/s from this machine (reasoned), and that figure is a property of my network, not of the dataset.
The card's own hashtag query costs more, because hashtags is a text column. The footers put that month's hashtags chunks plus footer at 1,168.8 MiB. DuckDB fetched 1.1 GiB in 98 GETs and finished in 45.4 s (measured). The top four tags in September 2026 were fyp (7,054,910 videos), viral (3,995,263), capcut (1,451,253) and foryou (1,425,338) (measured).
The widget below does that arithmetic for any query shape. Pick the columns a query names and a range of months. It sums the compressed column chunks and the footers it would have to read, from the 148 footers I measured. Two FROM styles are compared. Naming the monthly files reads only their footers. Globbing data/*.parquet with a WHERE posted_at filter opens all 148 footers, which costs 21.8 MB. The reader then rules out every other month's row groups from their min/max statistics, and it must also read posted_at for the row groups it keeps.
presets
columns the query names (1 of 31)
SELECT hashtags
FROM 'hf://datasets/datasocial/tiktok-5.6B-videos/data/2026-09.parquet';
Orange: bytes the reader fetches. Pale blue: the files in the range, if you downloaded them. Grey: the whole 460 GB dataset.
- bytes fetched
- 1.23 GB
- of the files in range
- 11.19%
- footers read
- 1 · 380.2 kB
- at 7.3 MB/s
- 3 min
- rows in range
- 98,594,752
- row groups kept
- 96 of 96
- download instead
- 10.95 GB
- posted_at added
- no
What pruning does inside a month. A WHERE posted_at filter skips whole months easily, because each month is its own file and its row groups' ranges never cross into another month. Inside a month it does less than you would hope. In the September file, the median row group spans 0.9 days. But 34 of the 96 row groups span the entire month: row group 0 runs from 2026-09-01 00:00 to 2026-09-30 23:59:55 (measured). No time filter can skip those. So a one-day filter on September 2026 still reads 40% to 47% of the month's bytes, depending on the day (measured from the row-group min/max). Perfect pruning would read about a thirtieth, 3.3% (reasoned). Other months do better: 12% to 14% for July 2025, and 20% to 26% for May 2026 (measured). Every file up to 2018-02 is a single row group, so there a day filter saves nothing.
The full-month row groups look like a second batch written next to a time-ordered one (reasoned). The card does not say. Re-sorting each month by posted_at before writing would bring a one-day query close to that thirtieth. A user cannot do that without downloading the month first. Filters on other columns, such as country or views, depend on the same min/max ranges, and I did not measure how well they prune. For an equality test, the bloom filters are the other way to rule out a row group.
What one month looks like up close
I downloaded the smallest recent file, 2026-10.parquet (190,959,864 bytes, 1,734,031 rows, three days: 2026-10-01 00:00 to 2026-10-03 13:00 UTC), and queried it locally with DuckDB. Every figure in this section is measured on that file. Three days of one month is not the dataset. These are aggregates only, and I did not look up any individual creator.
Engagement is extremely skewed. Median views are 347. The 90th percentile is 8,391 and the 99th is 150,387. The top 1% of videos by views hold 6,951,788,887 of the file's 13,744,149,872 views, which is 50.6%. 0.95% of videos show zero views. Median engagement_rate is 0.074 for videos with at least 100 views. 562 rows report more likes than views, which is a stats-refresh artefact rather than anything real.
Format and reach. 1,500,431 rows are videos and 233,600 are photo posts. The median video runs 25 seconds. country takes 228 distinct values, and the US is the largest at 459,925 rows (26.5%). language is un (undetermined) for 876,930 rows, 50.6% of the file.
Hashtags. The file holds 3,940,828 hashtag uses across 778,135 distinct hashtags. 37.9% of videos carry none. The top five are fyp (96,410), viral (59,877), foryou (38,773), capcut (30,833) and foryoupage (28,582). The card says hashtags are lower-case, and none contains an upper-case letter. However, 0.79% of hashtag strings begin with a literal #, such as #tiktoklive. Those count separately from the same tag without it.
Commerce. is_shop_video is set on 131,347 rows (7.6%), is_ad on 88,853, and branded_content is shop_affiliate on 39,465 and paid_partnership on 14,809. sound_muted (audio removed for copyright) is set on 143,739.
The AI flag. In this file, is_ai_generated is 1 on 84,804 rows, 0 on 1,047,198 and null on 602,029. Of the rows TikTok labelled, 7.5% are flagged as AI-generated. Across the whole dataset, though, the footers count 5,448,510,728 nulls in that column out of 5,598,141,717 rows: 97.3% (measured). It is between 99.4% and 100% null in every year from 2015 to 2025, and 90.2% null in 2026. Any question about AI content on TikTok has to be asked of 2026 only, and of the minority of rows where TikTok said either way.
A timestamp bug. 602,021 rows, 34.7% of the file, have stats_updated_at earlier than posted_at, by a median of 185 hours. Engagement counts cannot be read a week before a video exists. The same rows are null on is_ai_generated in all but one case, which points at a second ingestion path. posted_at is the trustworthy timestamp. TikTok IDs carry their creation time in the top 32 bits, and video_id >> 32 lands a median 10 seconds before posted_at in both groups. So for those rows, views is "as of some time" rather than "as of stats_updated_at". Anyone computing growth rates from these columns should filter stats_updated_at >= posted_at first. I checked one file. I cannot say how widespread this is in the other 147.
Provenance, terms and personal data
This part is factual, not legal advice.
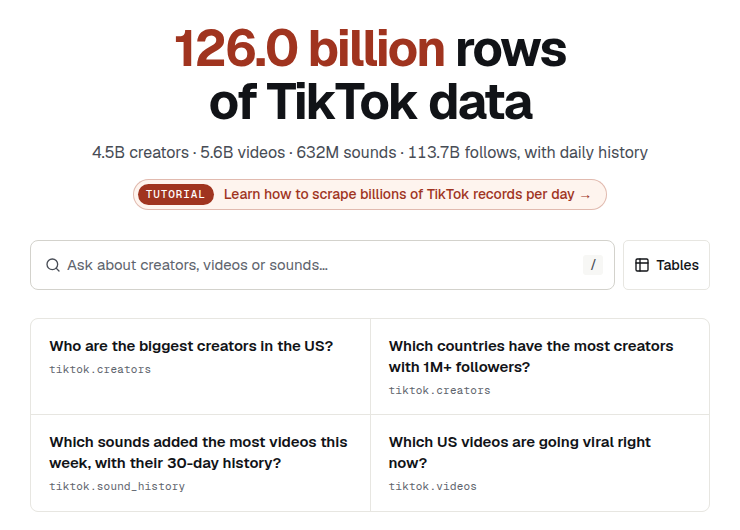
How it was collected. The card describes "5,597,462,038 public TikTok videos". It does not describe the collection method. The publisher's site, datasocial.ai, says more. Its front page links a tutorial titled "Learn how to scrape billions of TikTok records per day". The site sells "the scraper code" and a full export, and it says it is "not affiliated with, endorsed by, or connected to TikTok or ByteDance". I did not read the tutorial or the code, and this article does not describe how to scrape.
TikTok's terms. TikTok's EEA Terms of Service, section 4.5, prohibit users from trying to "extract any data or content from the Platform using any automated system or software that is not provided by TikTok or approved in writing by TikTok" (reported). The US terms carry a similar clause. Nothing on the card or the site claims TikTok's approval. A contract term binds the parties who agreed to it. How far it reaches someone who downloads a published copy is a question for a lawyer, not for this article.
The licence. The card says CC BY-NC 4.0, "free for research and personal use", with commercial use sold separately. A licence can only grant rights its licensor holds. Captions and on-screen text are written by the people who posted them, so CC BY-NC tells you what datasocial permits. It does not settle whether those creators permitted anything (reasoned). The site's own terms forbid copying its database out in bulk or giving it on as a dataset without written agreement. The Hugging Face release is the publisher doing that itself.
Personal data. The free files have no author column, but they are not anonymous:
mentionsholds creator IDs. In the October file, 8.5% of videos mention at least one (measured).captionandon_screen_textare free text written by people, and they contain names and handles. Text is 50.6% of the dataset's bytes (measured,captionpluson_screen_text).video_idresolves to a public page attiktok.com/@_/video/{video_id}, as the card notes, and that page names the creator.
Under the GDPR, "personal data" means any information relating to an identified or identifiable person, and Article 4(1) lists an "online identifier" as one way to identify someone. Recital 26 says pseudonymised data that can be re-linked to a person is still personal data. Article 14 sets out what a controller must tell people when it collects their data from somewhere other than them, and Article 89 allows some derogations for scientific research when safeguards are in place. Making data public on a platform does not take it out of scope. Datasocial's privacy page offers creators removal within 30 days on request by username (reported). Whether that meets the regulation for a 5.6-billion-row copy that others have already downloaded is not something I can assess. A researcher in the EU who wants to use these files should talk to their institution's data-protection officer before downloading them, not after.
What it is good for, and what it is not
Good for:
- Aggregate questions on 2026 data. Hashtag frequencies, format mix (photo vs video), shop and ad prevalence, duration distributions, and the AI flag where TikTok gave one.
- Teaching columnar analytics. It is a real, large, well-typed Parquet set with honest footers, and the gap between 184.7 MiB and 10.95 GB is the best demonstration of column pruning I have seen on public data.
- Text corpora for classification research, inside the licence and the data-protection constraints above.
Not good for:
- Platform-level trends over time. The monthly counts measure the crawler (see the 2020 and 2025 steps).
- Anything about creators. That table is not in the free release. Joining across releases to rebuild it is exactly the profiling the GDPR concerns are about.
- Engagement dynamics. One snapshot per video. For a third of the October rows, the snapshot's timestamp is wrong.
- Claims about AI-generated content before 2026. At least 99.4% null in every one of those years.
- Commercial use. The licence says no.
Related
The same footer-first method counted a 1.2 TB code corpus in UltraData-Code: counting a 1.2 TB corpus without downloading it, and released Parquet was the ground truth in Code2Skill. DuckDB was also the measurement harness behind Jev swarms: one call, ten agents, and the answer moves.