2026-10-17 · 16 min · agents · self-improvement · evolutionary-search · mle-bench · context-management · kernels · benchmarks
A 1:45 narrated explainer, drawn in code. Every number and picture in it is this article's own; the sources are below.
› transcript
Hi, I'm Doily! Long agent research runs stop improving while they stay busy. This harness notices, and sends agents somewhere new. Keep a compact dashboard of every experiment. When progress stalls, push a group of agents to disagree on purpose. An evolution loop changes a parent and scores the child. Every attempt lands in an archive. Scripts written before the run turn each attempt into one row of twenty five numbers. A monitor watches the best score. Flat for twenty minutes, and the search pauses. A cohort of agents scans the rows, opens a few full attempts, and runs its proposals in parallel. Then the search resumes. One shared dashboard gives everyone the same idea. So the agents are pushed apart. Each agent sees a different random subset of the metrics. Each proposes eight directions at once, so the unusual ones survive. Each builds on a different branch of the history, not the current best. Other fixes reset the agent and keep only the files. That loses the map. This one keeps a row per experiment, and opens the full record only when it matters. On the kernel task, the best case goes from twelve seventy five cycles to eleven oh nine. One run each. On a machine learning benchmark, it medals in seventeen of twenty two competitions, every seed. How much is the cohort is not shown. Don't throw the history away. Index it, and make the agents disagree when the search stalls. Score every attempt. Pause when progress goes flat. Send the agents out different ways. Every source is in the full article. I'm Doily. Bye!
Why read this
Solidtop 85%Recomputes RSI-top's stall share, kernel gains and cost from the page's own embedded run data, and shows what its MLE-bench comparison cannot attribute.
- Original analysis
- A new technique
- Concrete numbers to act on
Agents & harnessesAPI onlyResearch paper
How this was scored
- Is it new?
- 2 of 3: A real new idea, method or capability
- Can I trust it?
- 2 of 3: Measures key facts from files, code or configs
- Can I run it?
- 0 of 3: Closed, nothing to run
- Will I understand it?
- 2 of 3: Mechanism from first principles with figures
- Can I act on it?
- 2 of 3: A concrete recipe, numbers or comparison
- Will it last?
- 1 of 3: Relevant for months
- Does it affect many?
- 1 of 3: A specialist community
- Only here?
- 2 of 3: A teardown or measurement few others did
Score 56 of 100, ranked 394 of 577 rated articles. Each question is answered 0–3 by hand, and a 3 is rare. How articles are scored
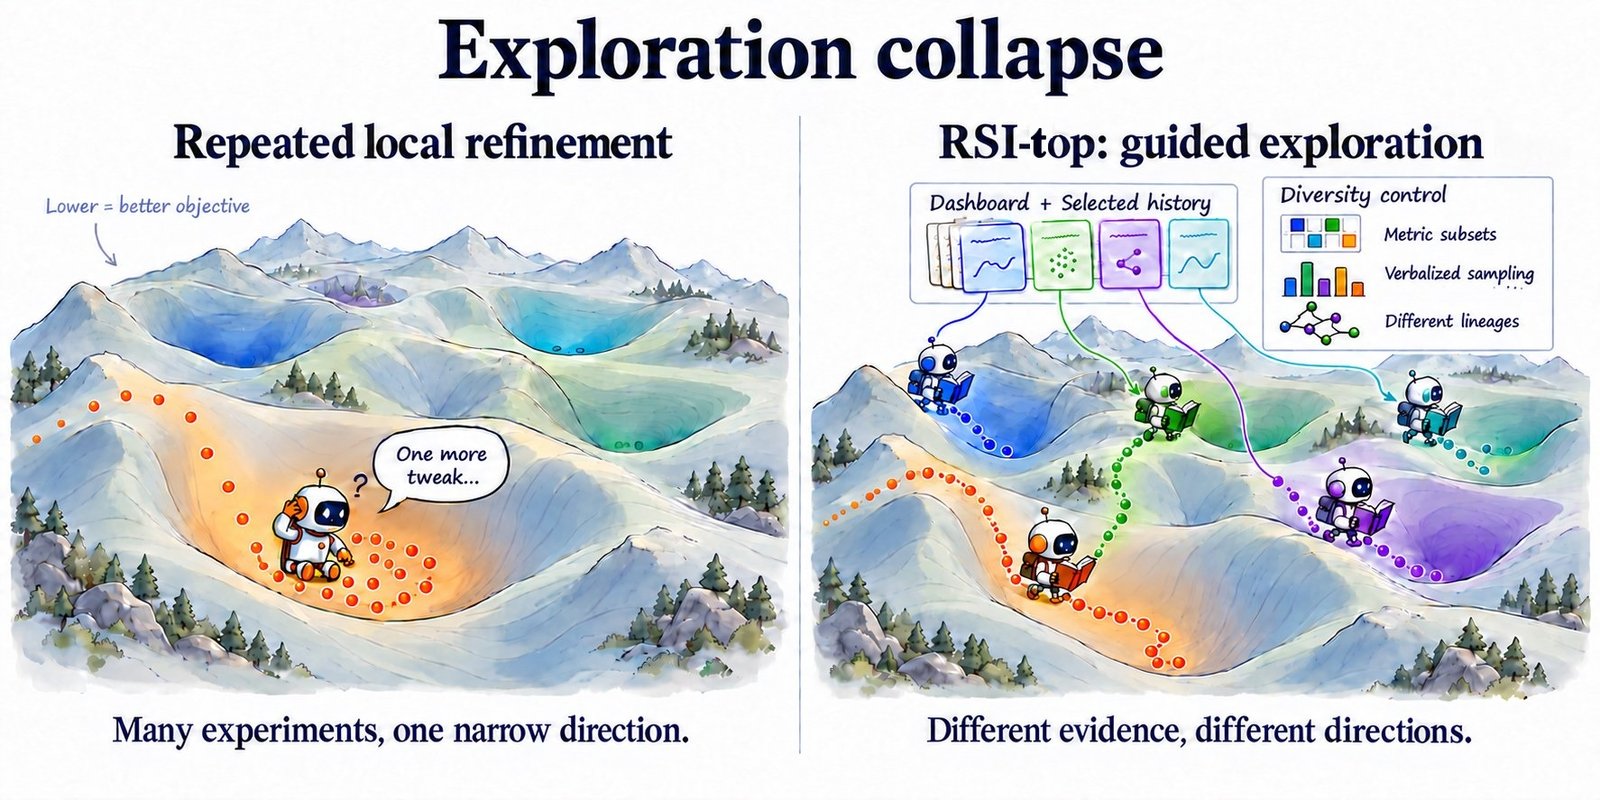
An autoresearch agent that runs for twelve hours does not fail loudly. It keeps running experiments. The experiments keep passing. The best score just stops moving, and every new proposal is a small edit to the same idea. RSI-top, from Yuzhen Mao, Jacky Kwok, Shayan Talaei and Azalia Mirhoseini at Stanford's Scaling Intelligence Lab, names that state exploration collapse and adds a harness around an existing search loop to climb out of it.
The name is a pun on htop. The core object is a dashboard: one row of numbers per experiment, so an agent can see what a long run has tried without reading it. When the run stalls, a cohort of agents reads that dashboard, pulls up the few experiments worth a closer look, and is pushed to disagree before it proposes anything.
What exists today is a project page and an 8-post thread. There is no arXiv paper and no code repository linked from either, as of 17 October 2026. The page, though, ships the raw run data for its kernel charts as JavaScript constants. I pulled those out and recomputed everything I could from them.
| Source | rsi-top.github.io, site commit e8102ce (16 Oct 2026); no paper, no code |
| Plugs into | OpenEvolve and ShinkaEvolve (kernel task); a plain ReAct loop (MLE-bench) |
| Models | Gemini 3.7 Flash and DeepSeek v4 Flash; Claude Opus 5 on MLE-bench Lite; GPT-5.6 Sol and Claude Opus 5 as $300 reference runs |
| Headline claims | Up to 15% over OpenEvolve and ShinkaEvolve on Anthropic's kernel task; 77.3% medal rate on MLE-bench Lite, 11.4 points over the best baseline |
The loop that stalls
An autoresearch run is a sequence of experiments linked by parent and child. Each iteration picks an earlier candidate as the parent, proposes a change, implements it, and gets a new candidate: a kernel, a training script, a checkpoint. An evaluator scores it and the result joins the archive. The project page calls the full record of one iteration (reasoning, code changes, execution and evaluation logs) a trajectory, and the best score so far the frontier. A run makes hundreds of trajectories.
Evolutionary frameworks such as OpenEvolve, the open-source reimplementation of AlphaEvolve, and ShinkaEvolve own the selection and mutation rules of that loop. Dream-RSI rewrites that scheduler between rounds. RSI-top leaves it alone and wraps it.
The failure it targets is easy to state and hard to fix from inside the loop. The agent settles into one valley of the idea landscape and keeps refining there. The project page cites Drew Breunig's context inertia as one likely contributor: the model commits to a direction in its context and keeps pursuing it after the evidence says to change course. Every attempt in that direction adds context that pulls the next attempt the same way.
The obvious fixes all discard something. Full history overflows the window. Summarising every few trajectories fits, but each compression drops detail. Resetting the context, as Fork-and-Flush (arXiv 2610.07447), Scaling Discovery Requires Forgetting (arXiv 2610.20563) and Anthropic's Memento harness do, keeps the workspace and throws the conversation away. That cures the fixation but leaves the next agent with no map of what was tried, and leaving a valley takes exactly that map. Context Language Models attacks the same overflow from the other side, by letting the model edit its own context file.
A stall, on the kernel task, is any stretch of at least 20 minutes after the first hour in which the best score improves by fewer than 2 cycles (reported). The page says the frontier sits stalled for 84% to 92% of each run (reported). The stall windows are in the embedded data, so I summed them: 86.1%, 84.4%, 92.0% and 87.5% of wall-clock time for OpenEvolve with DeepSeek v4 Flash, OpenEvolve with Gemini 3.7 Flash, ShinkaEvolve with DeepSeek and ShinkaEvolve with Gemini (measured, from the page's data). The claim holds. The page is careful to add that a stall alone does not prove exploration has collapsed. It is only the trigger.
How RSI-top works
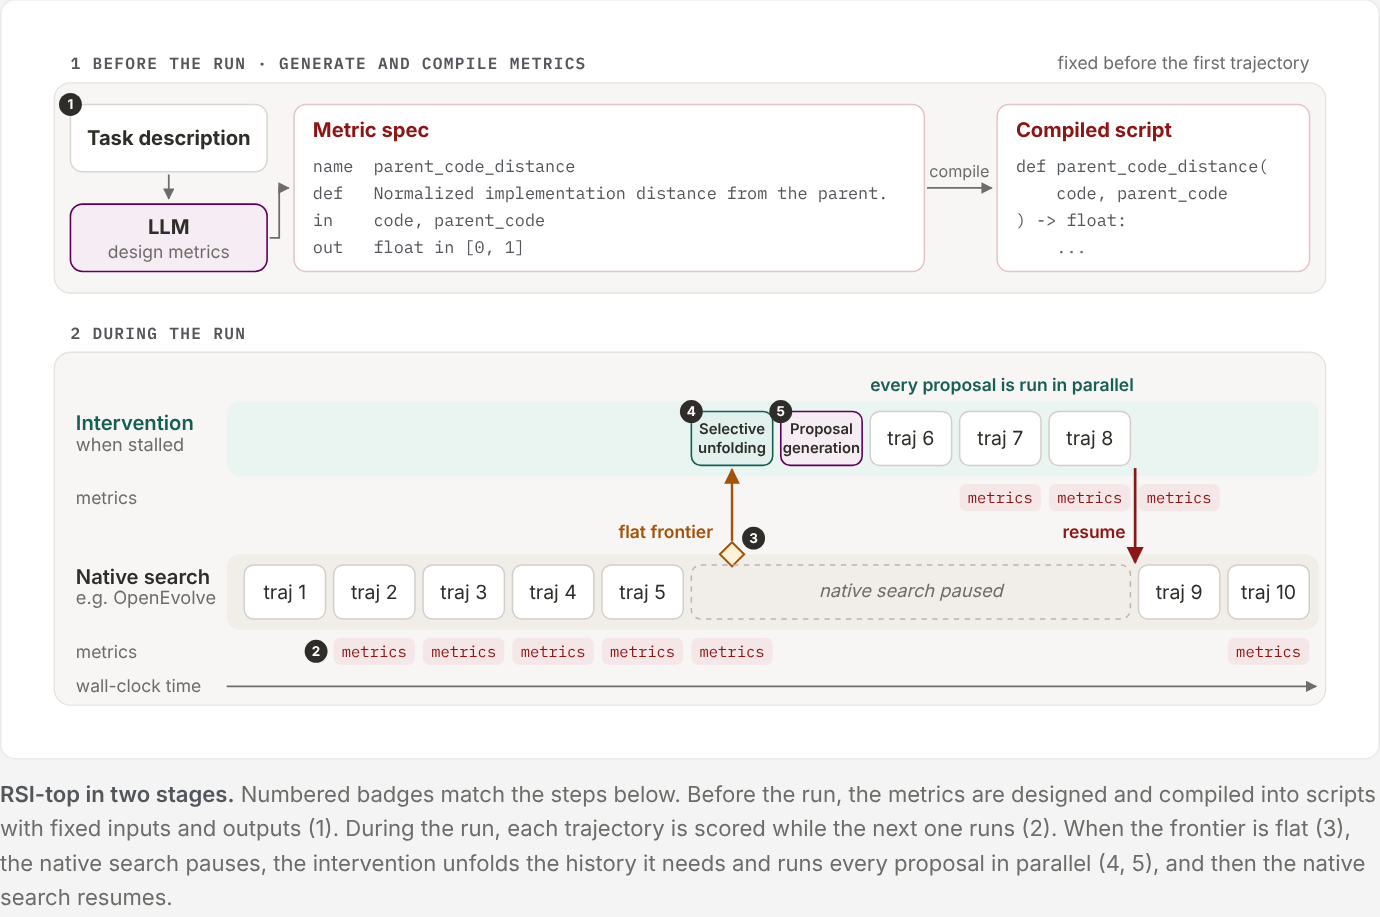
There are five steps, two before the run and three during it.
- Design metrics. Before the first trajectory, an LLM reads the task description and writes metric specs, each with a fixed input and output. Each spec is compiled into a script. The definitions are frozen for the whole run.
- Score in the background. When a trajectory finishes, the scripts score it while the agent is already running the next one. Each trajectory becomes one row on the dashboard.
- Detect stalls. A monitor watches the frontier. When it goes flat, it pauses the native search.
- Unfold selectively. Agents scan the metric rows and load ("unfold") only the few full trajectories that look useful for escaping.
- Intervene, then hand back. Agents propose new directions; every proposal runs in parallel as its own trajectory; the results join the archive; the native search resumes. Its selection and mutation rules are unchanged throughout.
For the kernel task the generated dashboard has 25 metrics (reported), in four scopes I counted from the page's table: 3 about the trajectory on its own (cycles, valid_attempt, recorded_change_count), 7 comparing it with one reference such as its parent or the frontier (parent_gain_cycles, frontier_code_distance), 11 over a recent window (window_redundancy_rate, repeated_failure_rate, parent_selection_concentration) and 4 over the whole run (seconds_since_meaningful_improvement) (measured, from the table). Several are direct sensors for collapse: how concentrated parent choice is, how much of the window is duplicate work, how often a failure signature repeats. Two of them, best_descendant_cycles and descendant_frontier_move_count, describe a row's descendants "by the frozen audit cutoff", so they are filled in after the fact and can only describe the past by the time an intervention reads them.
Three ways to make a cohort disagree
A shared dashboard does not make proposals diverse by itself. Four agents reading the same rows tend to unfold the same trajectories and reach the same conclusion. RSI-top pushes them apart three ways (reported):
- Different views. Each agent sees a random 15 of the 25 metrics. Agents watching different signals rank the history differently, unfold different trajectories, and blame the stall on different things. The page's analogy is an ensemble whose members see different features.
- Different ideas. Following Verbalized Sampling, each agent proposes eight directions as one portfolio, each with a
verbalized_probability: how likely an ordinary planner would be to propose it. Low values mark less obvious ideas. They need not sum to 1 and are not a chance of success. The prompt asks that directions differ in their "bottleneck -> mechanism -> expected-effect hypotheses", not in a parameter. - Different starting points. Parent links turn the archive into a DAG. Each agent is asked to find distinct causal subgraphs and ground its directions in different lineages, so the cohort does not all branch from the frontier.
The page gives no cohort size in the text, and no ablation of any of the three mechanisms or of the dashboard. So whether each one matters, or which does the work, is not something the release shows. To get a feel for why they might interact, I built a toy. It is not RSI-top. It is a 2D landscape with five valleys, A (depth 0.55) to E (depth 1.0), a native search that refines its best point in the direction that last helped, and a stall-triggered cohort of four agents with two proposals each. Every configuration spends the same 240 evaluations.
Across 20 seeds of the toy, the native search alone finds a mean best depth of 0.55 and never leaves valley A. Turning interventions on with every mechanism off changes nothing: four agents reading the same frontier propose the same small tweak. Each mechanism alone barely moves the mean (0.55 to 0.60). Far-apart ideas plus far-apart parents reach a mean of 0.80, and 10 of 20 runs go deeper than 0.8 (measured, in the toy; illustrative only). The toy's lesson is about mechanism, not magnitude: diverse proposals from the same parent explore without landing anywhere better, and diverse parents with the same timid proposal do not travel. Whether real agents behave like this is what an ablation would have to show.
Anthropic's kernel task, and what "up to 15%" compares
"Anthropic kernel optimization" is the original performance take-home Anthropic published for engineering candidates. I cloned it and read it. You write a kernel for a simulated VLIW SIMD machine: one core, vectors 8 wide, per-cycle slot limits of 12 ALU, 6 vector ALU, 2 load, 2 store and 1 flow. The kernel is a parallel tree traversal. Each of 256 inputs, for 16 rounds, hashes its value with the current node's value and steps left or right on the parity of the hash, on a tree of height 10 (measured, from problem.py and tests/submission_tests.py). The score is the cycle count of a correct run. The starter code takes 147,734 cycles.
The README's yardsticks are for the two-hour version that starts at 18,532 cycles: Claude Opus 4.5 reached 1,487 cycles after 11.5 hours in Anthropic's harness and 1,363 in an improved one (reported, from the README). RSI-top's charts use that 1,363 as the unit: normalized performance is 1363 / cycles, so higher is better and 1.0 means Opus 4.5's best. The README also warns that every solution under 1,300 cycles it received on day one was invalid, because the model had edited the tests. RSI-top's dashboard carries a valid_attempt metric for "an authoritative valid evaluation". Without code or solutions I cannot check how that evaluation guards the test folder.
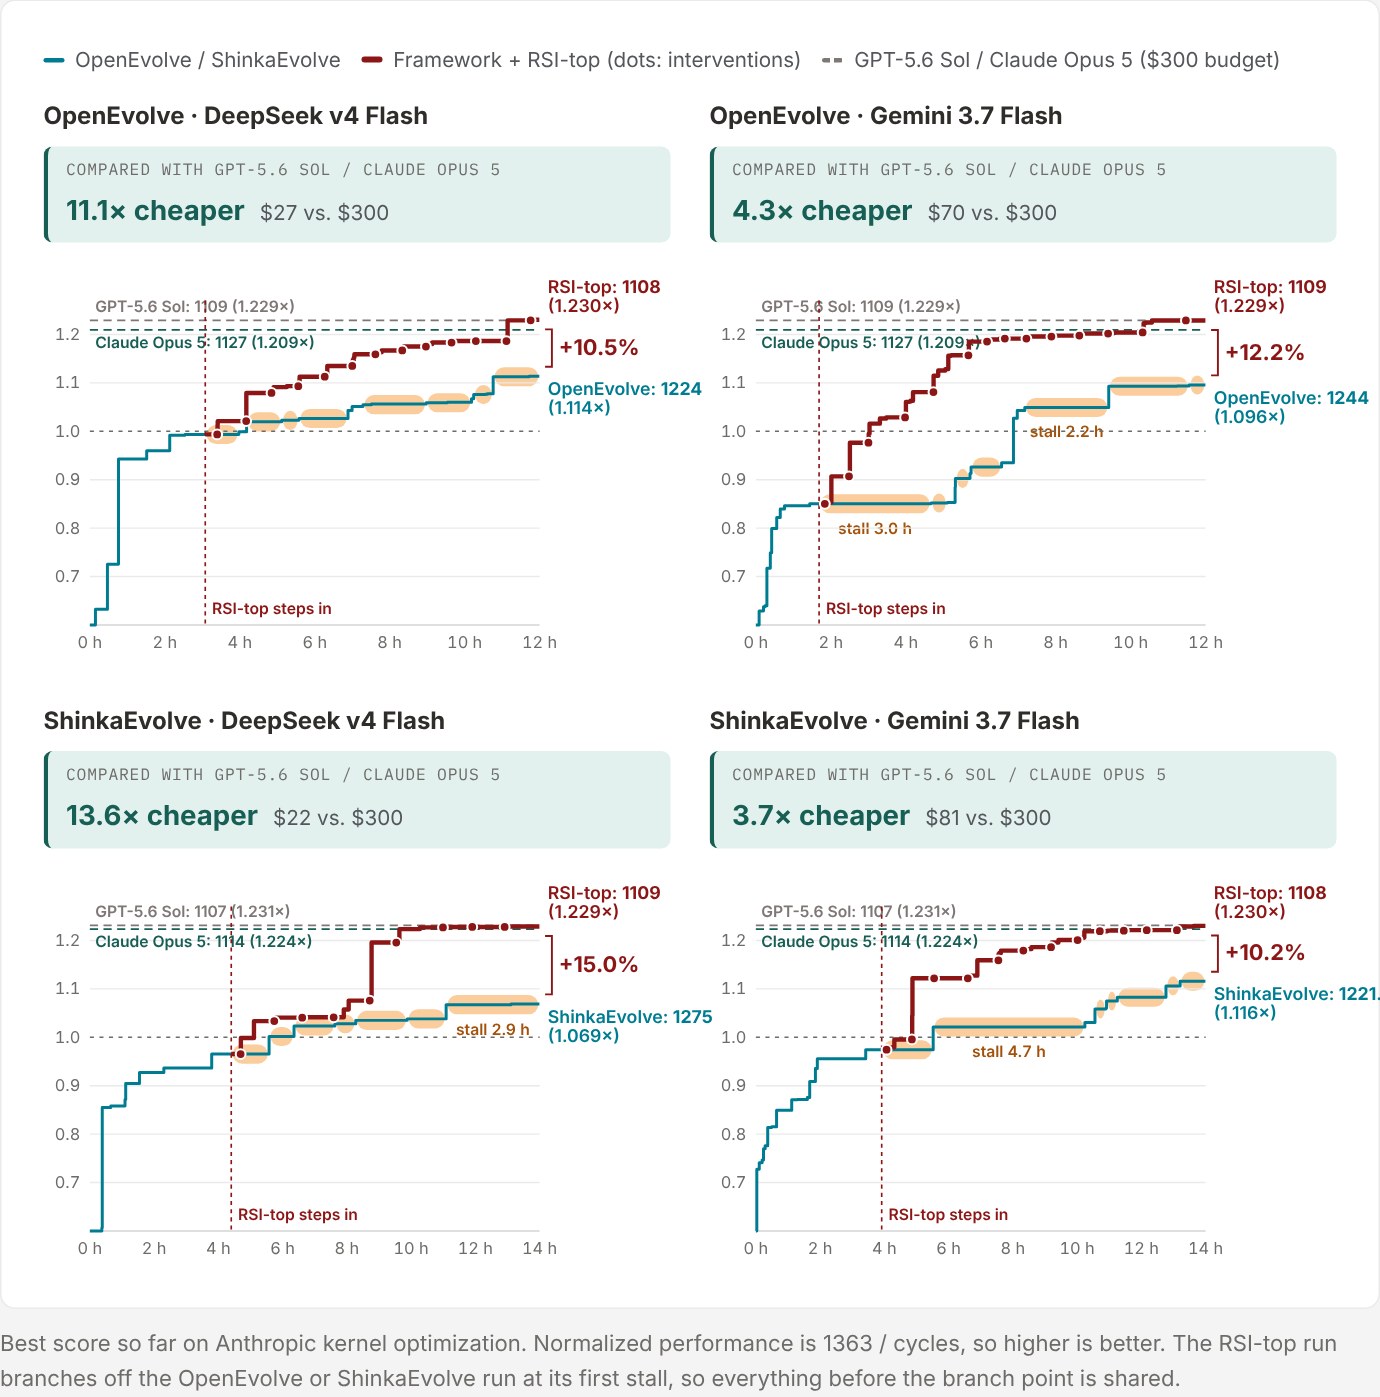
Here is what each panel compares. The RSI-top run is not a fresh run. It branches off the framework's own run at its first stall, so everything before the branch point is shared, and from there the two continue for the same wall-clock time. That is a good control for luck before the stall. It is also one run per pair, with no repeat seeds and no spread.
| Run | Branch at | Alone, cycles | + RSI-top, cycles | Gain | Interventions | RSI-top cost |
|---|---|---|---|---|---|---|
| OpenEvolve, DeepSeek v4 Flash | 3.08 h | 1224 | 1108 | +10.5% | 13 | $27 |
| OpenEvolve, Gemini 3.7 Flash | 1.69 h | 1244 | 1109 | +12.2% | 14 | $70 |
| ShinkaEvolve, DeepSeek v4 Flash | 4.40 h | 1275 | 1109 | +15.0% | 9 | $22 |
| ShinkaEvolve, Gemini 3.7 Flash | 3.92 h | 1221.5 | 1108 | +10.2% | 12 | $81 |
The cycles, branch times, intervention counts and costs are the page's data (reported). The gain column is mine: the alone cycles divided by the RSI-top cycles, minus one (reasoned). So "up to 15%" is the best of four single runs, and it is a throughput ratio. In cycles, 1275 to 1109 is 13.0% fewer (reasoned).
Three things in this data are worth more than the headline.
All the RSI-top runs end in the same place. They finish at 1108 or 1109 cycles whatever the framework and the model. The GPT-5.6 Sol reference runs, given $300 of API budget each, end at 1107 to 1109; Claude Opus 5 at 1114 to 1127 (reported). So the claim that a Flash-class model "reaches nearly the same score at a fraction of that cost" holds: $22 to $81 against $300, or 3.7 to 13.6 times cheaper (reported). But four different routes and the strongest reference all stopping within two cycles of each other suggests a shared floor for this family of solutions (reasoned). Read that way, the 10 to 15% is mostly the gap between a stalled search and that floor, not distance past it. For scale, 1108 cycles is 18.7% fewer than Opus 4.5's 1,363 (reasoned).
The gain arrives with the interventions. Interventions fire every 42 to 62 minutes on average, from soon after the branch to the end (measured, from the intervention times). Of the RSI-top branch's total improvement, 99%, 91%, 79% and 100% in the four runs lands within 20 minutes of an intervention starting (measured, from the page's data). The intervention proposals run in parallel right after it starts, so this is consistent with the cohort's own candidates producing most of the gain, rather than a revived native search (reasoned; the data does not say which trajectory produced each step).
The cost comparison is one-sided. The page prices the RSI-top run against the $300 frontier-model runs. It does not give the cost of the framework-alone run, so RSI-top's overhead over the loop it wraps, a cohort of agents unfolding trajectories a dozen times per run, is not reported.
MLE-bench: the 77.3%, unpacked
MLE-bench is OpenAI's benchmark of 75 Kaggle competitions. An agent gets the task and a compute budget, and its final submission is graded on the held-out test set against Kaggle's own leaderboard. A medal means the submission would have earned bronze or better under Kaggle's thresholds for that competition. MLE-bench Lite is the 22-competition Low-complexity split. The page also reports Valid (a gradable submission), Med+ (above the leaderboard median) and Gold. The AIRA piece covers the benchmark's quirks in more depth, including the validation-to-test gap.
On MLE-bench, RSI-top wraps a simple ReAct loop, not an evolutionary framework. It runs on one A100 (80 GB) for 12 hours (reported).
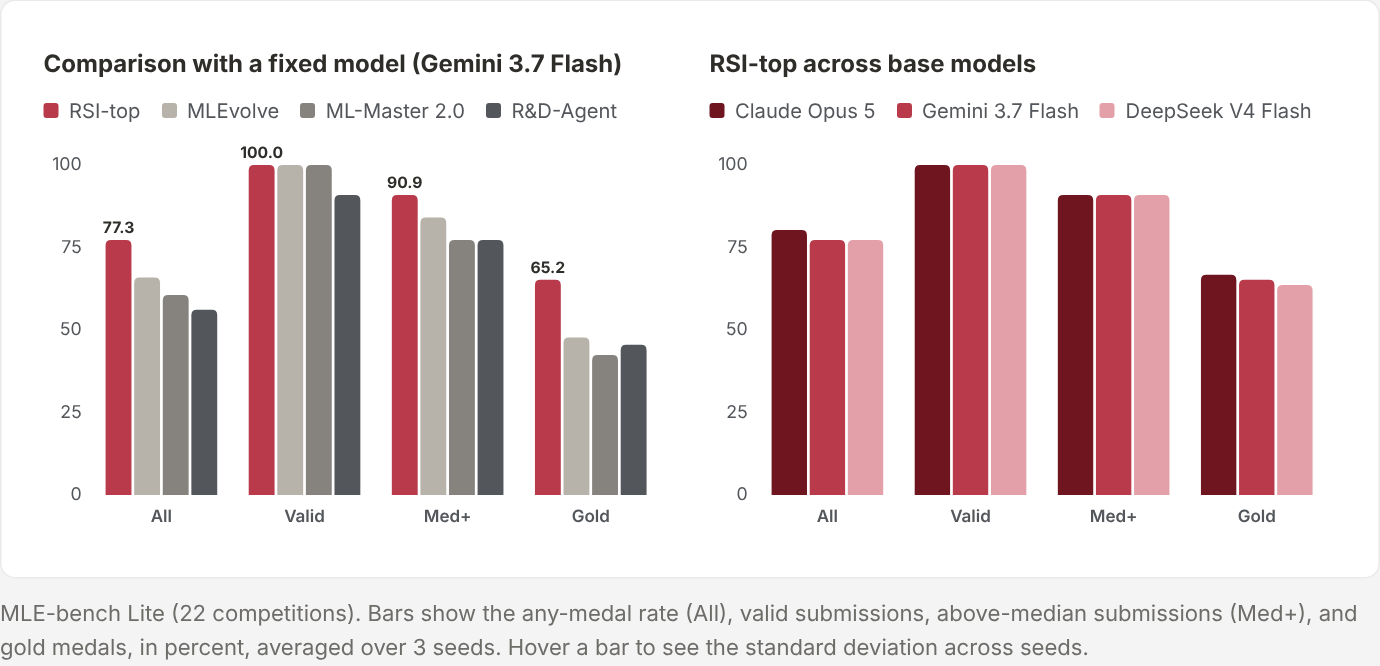
The bar values are in the page's script, with standard deviations over 3 seeds (reported):
| Gemini 3.7 Flash, MLE-bench Lite | Any medal | Med+ | Gold |
|---|---|---|---|
| RSI-top | 77.3 ±0.0 | 90.9 ±0.0 | 65.2 ±3.0 |
| MLEvolve | 65.9 ±2.3 | 84.1 ±6.8 | 47.7 ±2.3 |
| ML-Master 2.0 | 60.6 ±5.5 | 77.3 ±4.5 | 42.4 ±3.0 |
| R&D-Agent | 56.1 ±3.0 | 77.3 ±2.6 | 45.5 ±2.6 |
The 11.4 points is 77.3 minus MLEvolve's 65.9 (reasoned; it checks out). On 22 competitions, 77.3% with zero spread is exactly 17 medals in each of the 3 seeds, and 65.9% is a mean of 14.5 (reasoned). The gap is about three competitions. RSI-top on Claude Opus 5 scores 80.3 and on DeepSeek V4 Flash 77.3 (reported), so the result is not tied to one model.
What this comparison cannot say is how much of it is RSI-top. RSI-top runs on a ReAct loop, and there is no ReAct-without-RSI-top row with the same model and budget. The baselines are different frameworks altogether. The kernel task has that control, a branched run of the same framework, and this one does not. The page also does not say what budget and hardware the three reruns got.
The full 75-competition table mixes figures reported by other papers on other models, hardware and budgets, mostly 24 hours against RSI-top's 12. There RSI-top's any-medal mean is 63.1 ±6.3, tied with AIBuildAI on Claude Opus 4.6 at 63.1 ±0.4 (reported). Its 77.3 Med+ and 43.1 gold are the highest in the table (reported). The ±6.3 is wide: about 4.7 competitions of 75 (reasoned). Two oddities are worth knowing before quoting any of it. First, the post's "77.3% medal rate" is the Lite any-medal figure; the full-benchmark medal rate is 63.1%, and 77.3 there is the Med+ rate. Second, the full table's Low column, the same 22 competitions on the same model and budget, gives RSI-top 80.3 ±2.6, not the 77.3 ±0.0 of the Lite chart. Presumably those are separate sets of runs. The page does not say.
What it costs, and where it breaks
- Not released. No paper, no code, no prompts beyond two excerpts, no trajectories. Every number here is either the page's or my arithmetic on the page's data. Nothing was re-run.
- No ablations. The three diversity mechanisms and the dashboard are presented as a package. Nothing shows which of them carries the result.
- Variance. The kernel result is one branched run per pair. The MLE-bench results have three seeds, and RSI-top's full-benchmark spread is the widest in the table.
- Compute. Cohort size is not stated. Neither is the intervention's share of API spend, nor the framework-alone cost.
- Triggering needs a scalar frontier. A stall is defined on one score. Tasks without a clean scalar, or with noisy evaluation, need a different trigger. The page's own next step is to drop the trigger and let agents read the dashboard continuously.
- The dashboard is generated per task. An LLM designs the metrics; the 25 shown are for one task. How good that design step is elsewhere is untested in the release.
The idea itself is sound and cheap to borrow. Keep a structured, comparable index of every experiment instead of the whole history or a lossy summary. Retrieve full trajectories only when the index says they matter. And when a run stalls, make the agents disagree on purpose, in where they look, what they propose and where they start. Concurrent work fixes context inertia by forgetting; RSI-top fixes it by remembering in a form the agent can scan. The RRSI piece covers the other half of this design space: regularizing a self-improving harness so its search does not overfit. Terminal-RSI and RSI-Anything show how loose the "RSI" label has become. RSI-top is a harness for search that has stalled, and makes no claim of recursive self-improvement.