2026-10-08 · 35 min · scientific-ai · physics · datasets · benchmarks
Why read this
Notabletop 60%Superconductivity from BCS to the Hopfield sum, then RoomTSC's census and model checked: Eliashberg re-solved, labels recounted from raw data, limits named.
- Checked against the source
- Runs on a laptop CPU
- A lasting reference
Data & datasetsNo licenceResearch paper
How this was scored
- Is it new?
- 1 of 3: An incremental tweak
- Can I trust it?
- 3 of 3: Reproduces the headline result, or shows from primary files it is wrong
- Can I run it?
- 2 of 3: Open code or weights with real limits
- Will I understand it?
- 2 of 3: Mechanism from first principles with figures
- Can I act on it?
- 1 of 3: General advice
- Will it last?
- 2 of 3: A reference for a year or more
- Does it affect many?
- 1 of 3: A specialist community
- Only here?
- 2 of 3: A teardown or measurement few others did
Score 63 of 100, ranked 205 of 476 rated articles. Each question is answered 0–3 by hand, and a 3 is rare. How articles are scored
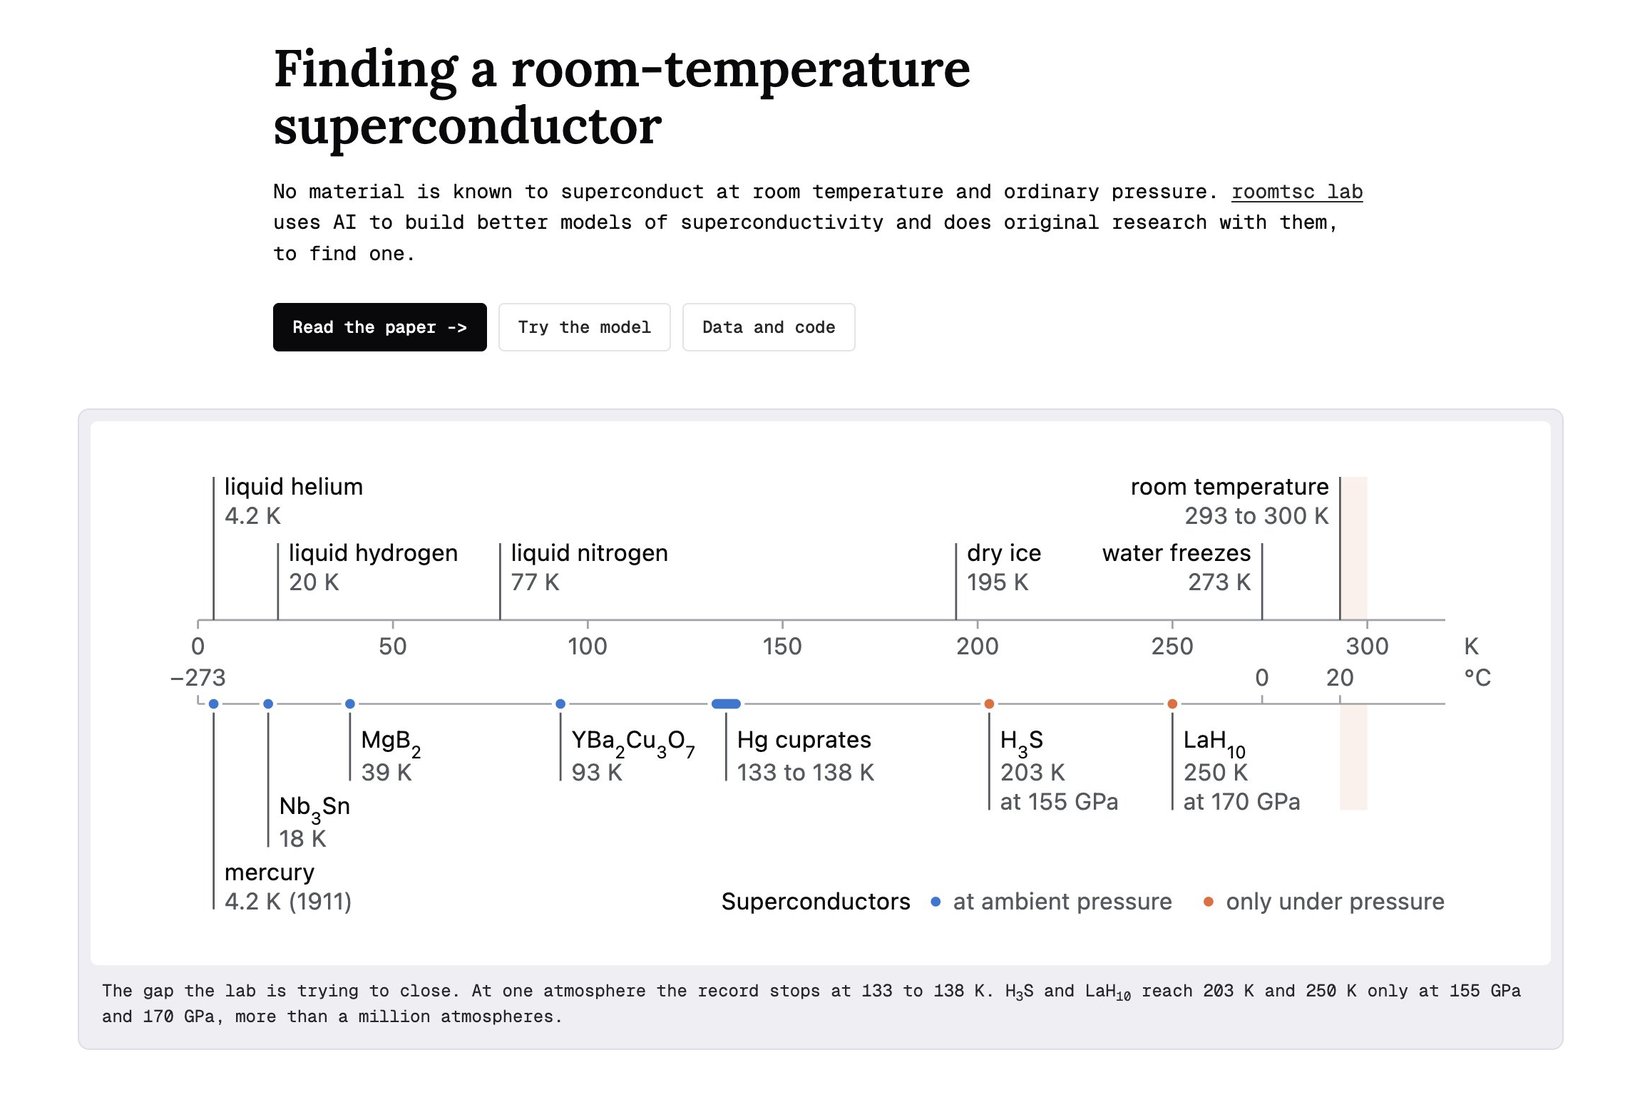
On October 7 @protosphinx announced RoomTSC, "a (very) small lab in SF working on a room-temperature superconductor", and then spent the rest of the post lowering expectations: "There's no way we can make tall claims. Nobody has found one since superconductivity was discovered in 1911 and we may not either." The pitch is about method more than material. "AI lets you work on moonshot ideas with few resources, which is the only reason a team our size can attempt this."
I opened roomtsc.com expecting the usual shape of an AI-for-materials launch: a generative model, a ranked list of exotic formulas, a predicted Tc next to each. What is there instead is a 41-page draft paper whose main result is a ceiling, a census of 4,619 calculated hydrides that finds none with the coupling 300 K needs, a model that refuses to predict Tc at all, and a test table with the failures left in. The paper even puts a number on its own odds: about one in a hundred.
That is unusual enough to be worth reading closely. It is also a good excuse to explain why room-temperature superconductivity is hard in the first place, because the paper's argument only makes sense once you know what BCS and Eliashberg theory say about where a transition temperature comes from. So this piece does both: the physics from the bottom, then the lab's paper and model checked against their own data files, which they publish in full.
What is actually on the site
Four things, all dated October 6 to 8, 2026.
The paper, Room temperature, one atmosphere, is Draft 6, 41 pages, by Shashank Dixit of ERP.AI. It asks what limits superconductivity at 300 K and ambient pressure and how far published calculations and experiments stand from each limit. Apart from one section it is confined to phonon-mediated pairing in hydrides.
The model, roomtsc 0.1, with a companion paper (Draft 2, 19 pages). It takes a crystal structure and estimates a quantity called the Hopfield sum, which sets an upper scale on Tc when phonons do the pairing. It does not predict Tc. Weights, training code, both sets of test splits and every result file are public, and there is an HTTP endpoint at roomtsc.com/api/predict.
A reference wiki of ten articles, each fact footnoted, covering the physics, the record, and how past claims fell apart. The data page lists the files and scripts behind every table and figure, including labels.csv (one row per compound with a spectral function) and the Eliashberg solver.
And a lab. The equipment page is a 115-item bill of materials for making and testing samples: furnaces, a pellet press, liquid-nitrogen cryogenics, resistance and susceptibility measurement. As of October 8 nothing on the site reports a sample made or measured. Everything so far is theory and computation, and the site says so.
Before getting into what the paper argues, the physics it rests on.
Why superconductors are cold
A superconductor, below its critical temperature Tc, carries current with zero resistance and pushes magnetic field out of its bulk (the Meissner effect). Heike Kamerlingh Onnes found it in mercury at 4.2 K in 1911. For the next 75 years every superconductor was a metal or alloy, and the record crept from 4.2 K to about 23 K.
The explanation came in 1957 from Bardeen, Cooper and Schrieffer. An electron moving through a crystal pulls the positive ions slightly towards it. The ions are heavy and slow, so the distortion lingers after the electron has gone, and a second electron is attracted to it. That delayed, phonon-carried attraction can beat the direct Coulomb repulsion between the two electrons, and when it does, electrons near the Fermi surface bind into Cooper pairs. The pairs condense into one coherent quantum state, and breaking a pair costs an energy gap . Scattering that would cause resistance in a normal metal cannot break a pair cheaply, so current flows without loss.
BCS theory in its weak-coupling form gives
where is a typical phonon frequency (the Debye frequency), the density of electron states at the Fermi level and the pairing attraction. Two things fall out of it. The prefactor is a phonon energy, so stiffer lattices and lighter atoms set a higher scale; that is the isotope effect, where swapping an element for a heavier isotope lowers Tc roughly as . And the exponent punishes weak coupling brutally. With the exponential is about 0.036, so a material with a 400 K Debye temperature lands near 16 K. That is roughly where conventional superconductors sat for decades.
Eliashberg: coupling as a spectrum
BCS treats the attraction as one number. Eliashberg (1960) replaced it with a spectrum, the Eliashberg function , which says how strongly phonons of each frequency couple to electrons at the Fermi surface. Three moments of it carry most of the physics:
is the dimensionless coupling strength, and a typical frequency. Repulsion between electrons enters as a single parameter , conventionally 0.10 to 0.13. McMillan (1968) fitted numerical solutions into a formula, and Allen and Dynes (1975) refined it into the version most high-throughput screens still use:
The modern pipeline is: compute a crystal structure with density functional theory, compute its phonons and electron-phonon matrix elements, integrate , plug into Allen-Dynes or solve the full Eliashberg equations. For most elemental superconductors fully first-principles calculations land within about 20% of the measured Tc. This is the one corner of superconductivity where theory can predict a material before anyone makes it.
Allen and Dynes found something else in 1975 that matters for everything below. At very large , Tc does not keep climbing exponentially. It approaches
Hold that thought. It is the hinge of the RoomTSC paper.
Why hydrogen, and why megabars
If the prefactor is a phonon energy, the obvious move is the lightest atom. Ashcroft argued in 1968 that metallic hydrogen should be a high-temperature superconductor: protons are light, so phonon frequencies are high, and a bare proton couples strongly to electrons because there is no core to screen it. The catch is that hydrogen only turns metallic at pressures of several hundred gigapascals. In 2004 Ashcroft proposed a shortcut: put hydrogen in a compound, and let the other atoms precompress it, so it goes metallic at a lower pressure.
That idea worked, with a twist. In 2015 Eremets's group measured 203 K in H₃S at 155 GPa, after Duan and coauthors had calculated it the year before. In 2019 they measured 250 K in LaH₁₀ near 170 GPa, reproduced by a second group. CaH₆ at 215 K and 172 GPa and YH₉ at 243 K and 201 GPa followed. Prediction came before measurement for each of these, which is rare in this field. The twist is that "lower pressure" still means more than a million atmospheres, in a diamond anvil cell, with samples a few tens of micrometres across. None of these phases survives decompression.
At one atmosphere the record belongs to the cuprates, which are not phonon-mediated in any settled sense: HgBa₂Ca₂Cu₃O₈₊δ at 133 to 135 K since 1993, 138 K with partial thallium substitution. The phonon record at one atmosphere is still MgB₂ at 39 K, from 2001. Room temperature is a factor of 2.2 to 2.3 above the cuprate record and nearly eight times MgB₂.
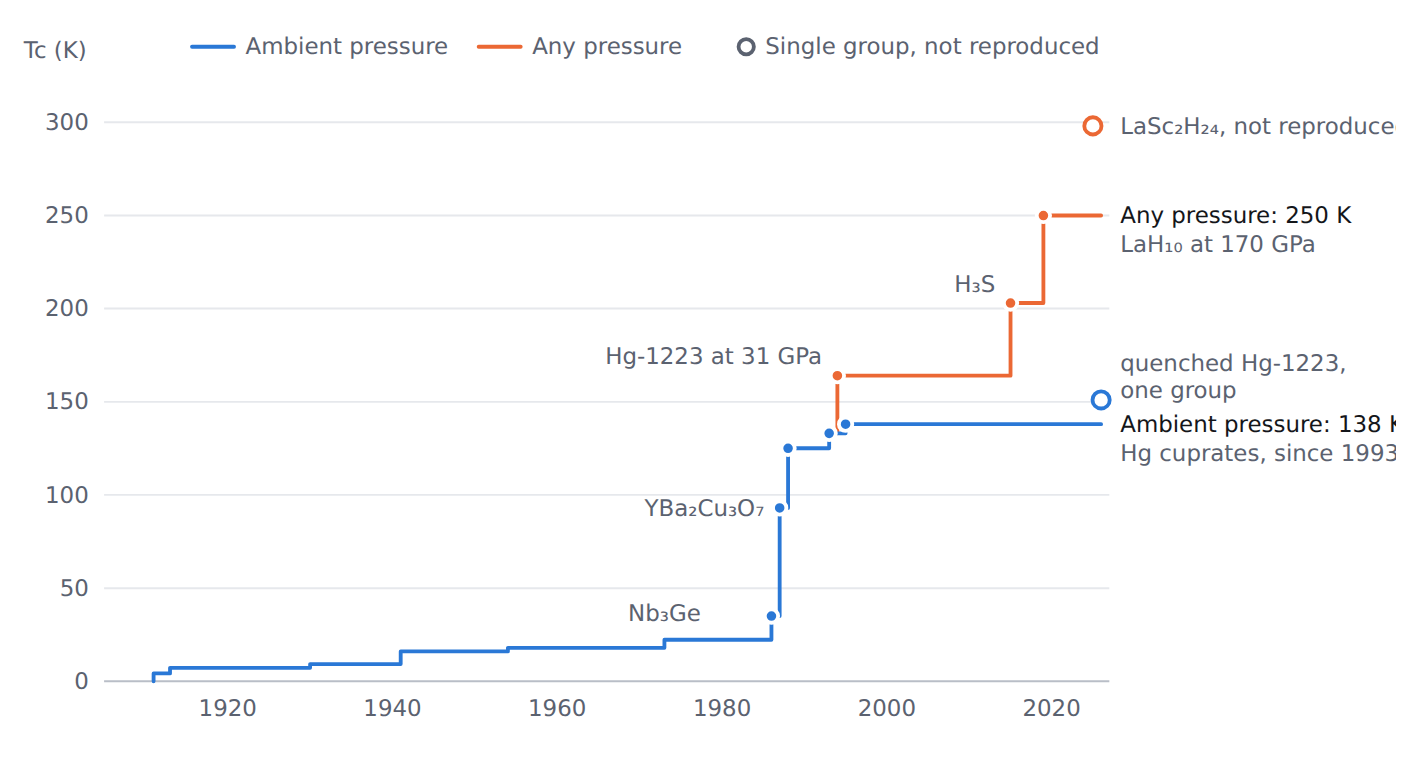
The landscape below puts the whole field on one chart: everything measured and reproduced, what only one group has seen, what was retracted, and what has only been calculated at one atmosphere. The 300 K line is empty on the left.
Read it left to right. In the one-atmosphere panel, reproduced superconductors stop at the mercury cuprate's 133 to 138 K. A pressure-quenched cuprate holding a 151 K onset at ambient pressure is one group's 2026 result, without reported zero resistance. LK-99's claim of 400 K or more sits alone at the top as a red cross. The grey diamonds are hydrides that calculations put between 59 and 175 K at one atmosphere, and none of them has been made at, or recovered to, one atmosphere. On the right, the reproduced hydrides cluster at 200 to 250 K and 155 to 201 GPa, the 298 K onset in LaSc₂H₂₄ at 260 GPa is one preprint, and three red crosses between 262 and 294 K are retracted papers.
The lesson of LK-99, and what counts as finding one
In July 2023 a Korean group posted two preprints claiming room-temperature, ambient-pressure superconductivity in a copper-doped lead apatite, LK-99, with " K". There was a video of a fleck of it half-levitating over a magnet. For about three weeks the internet attempted replication in real time.
It fell apart fast, and the way it fell apart is the useful part. The samples contained copper(I) sulfide, which has a structural phase transition at 104 °C with sharp jumps in resistivity; Jain and Zhu and coauthors showed that transition reproduces the "superconducting-like" drop, with thermal hysteresis and without zero resistance. The Max Planck group in Stuttgart grew phase-pure single crystals and found them "highly insulating and optically transparent", with a small ferromagnetic component that explains the partial levitation. Nature's news team called it within the month.
LK-99 at least failed honestly. The same years produced two Nature papers from the Rochester group, a carbonaceous sulfur hydride at 288 K and 267 GPa and a nitrogen-doped lutetium hydride at 294 K and 1 GPa, both retracted; a University of Rochester investigation later concluded that the group leader had fabricated data. The RoomTSC wiki counts eleven prominent claims above the record of their day that were refuted, retracted or never corroborated, nine of them at or above 273 K.
I bring this up because the most reassuring thing on RoomTSC's site has nothing to do with AI. Before making a single sample, the paper writes down a verification standard. For megabar claims it lists seven items: four-probe zero resistance with a stated noise floor and permuted contacts; a shift of the transition in applied field; a magnetic signature visible before background subtraction; warming and cooling sweeps to expose hysteresis from a structural transition; identification of the phase; release of raw data; reproduction by a second group. For a claim at one atmosphere it adds four more, including a bulk signature (specific heat, muon-spin rotation or field-cooled flux expulsion) set against the measured phase fraction, and, for a hydride, the hydrogen content measured directly. It notes that H₃S took about eight years to accumulate most of the first seven.
LK-99 would have failed the hysteresis item, the phase identification and the bulk signature. Writing the checklist before you have anything to check is the right order.
The paper's one idea: the Hopfield sum
Here is the move the whole paper rests on, and it is a good one.
You cannot search for a room-temperature superconductor by training on examples, because there are none. So instead of predicting Tc, the paper asks what quantity bounds Tc, and how big it must be. Go back to the Allen-Dynes limit, . The quantity under the square root has a property McMillan and Hopfield pointed out in the late 1960s: it does not depend on the phonon frequencies at all.
Each atom type contributes its Hopfield parameter , an electronic quantity (the density of states at the Fermi level times the squared electron-ion matrix element) divided by its mass. The phonon frequencies and eigenvectors cancel because the eigenvectors form a complete set. That matters because phonons are where calculations go most wrong in hydrides: anharmonicity and quantum nuclear motion shift by tens of percent. You can soften a mode to raise , but you pay in and stays put. The paper checks this with Li₂AuH₆, whose is 3.86, 2.10 and 2.67 under harmonic and two anharmonic treatments, while computed from the same tables is 3.62, 3.63 and 3.62 eV/Ų. (It also notes, correctly, that this agreement is an identity, not evidence that is accurate.)
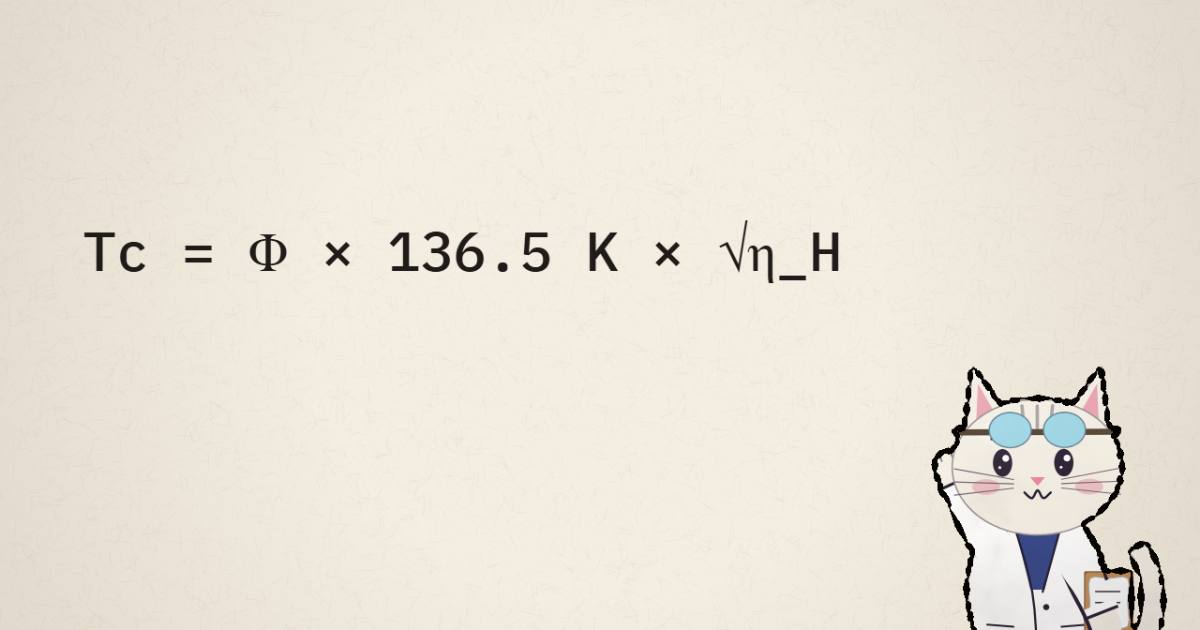
Writing the paper's equation 5 with hydrogen as the unit of mass,
where is an efficiency that depends on , and the shape of the spectrum. is below one in every solution the paper computed. I checked the 136.5 K constant by hand: is 747.3 K in temperature units, and 0.1827 of that is 136.5 K.
So sets the ceiling, and says how close a real spectrum gets to it. At , 300 K needs eV/Ų. That is the floor.
How much coupling 300 K costs
Real spectra are not at . To get a realistic requirement the paper solves the linearised isotropic Eliashberg equations on the Matsubara axis for a single phonon mode (an Einstein spectrum), with at a cutoff of ten times the mode frequency. For each coupling it gets , then the mode frequency and the that 300 K needs.
I wrote my own solver to check this, about 25 lines of NumPy: build the Matsubara kernel , the renormalisation , the gap kernel with cut off at , and bisect on temperature until the largest eigenvalue crosses one. My values for :
| paper (Table 2) | my solver | |
|---|---|---|
| 1.0 | 0.072 | 0.0725 |
| 1.5 | 0.124 | 0.1242 |
| 2.0 | 0.164 | 0.1640 |
| 3.0 | 0.225 | 0.2250 |
| 4.0 | 0.273 | 0.2737 |
| 5.0 | 0.314 | 0.3146 |
They agree to the digits printed. At , 300 K needs a mode at about 1,830 K (158 meV) and of 12.0 eV/Ų; at it needs 8.7. At the efficiencies of published ambient-pressure hydride spectra, 0.35 to 0.52, the requirement is 18 to 39 eV/Ų.
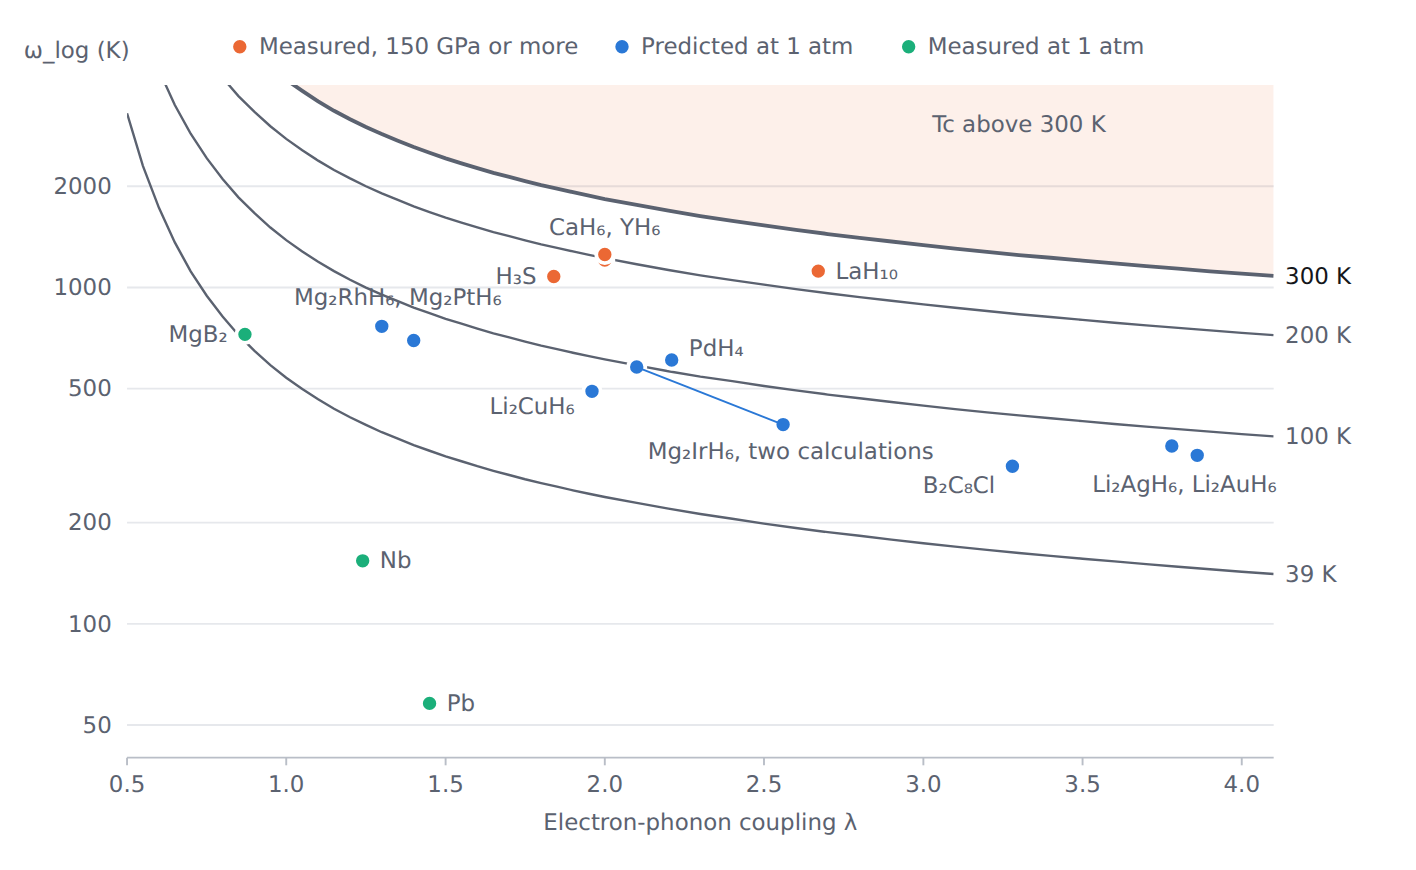
Figure 2 is the clearest picture of the problem. The ambient-pressure candidates can have big , but they get it with soft phonons. The megabar hydrides have both.
Pressure buys hydrogen density
The paper then splits into two factors:
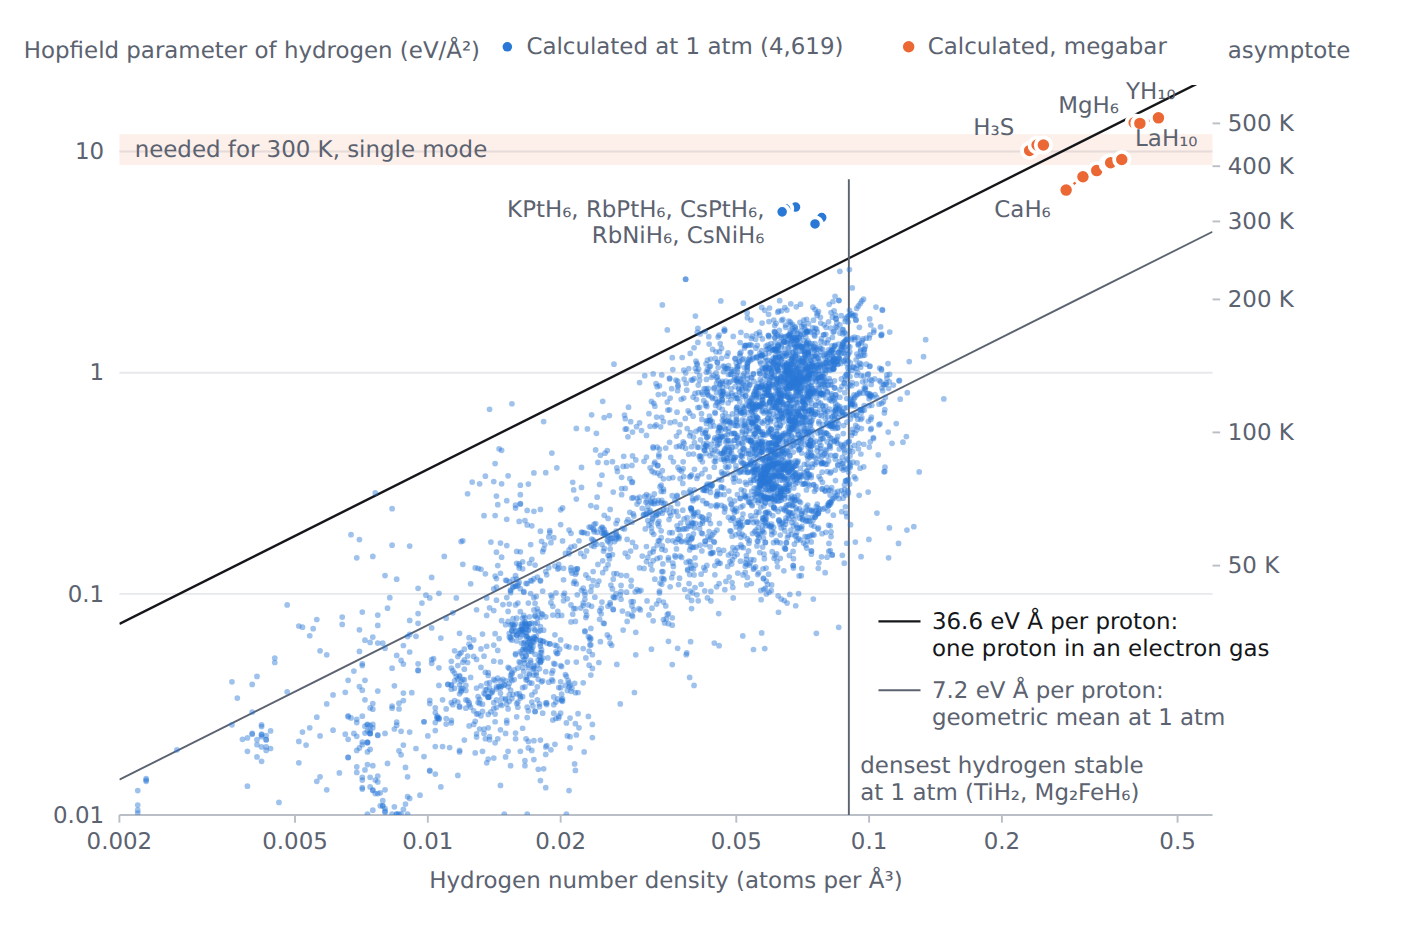
the hydrogen number density times a "scattering strength per proton" , in eV·Å. This is a definition and assumes nothing, but it turns out to explain where the megabar advantage comes from. For one proton in a uniform electron gas, follows from scattering phase shifts, and their own Kohn-Sham calculation gives 33 to 37 eV·Å at metallic densities, peaking at 36.6. The megabar hydrides have of 24 to 45, high but not exotic. What they have that nothing at one atmosphere has is density: 0.23 to 0.45 hydrogen atoms per ų, about 5.6 times the one-atmosphere median of 0.057; the paper rounds it to five to six times. The densest hydrogen they find in any compound stable at one atmosphere and room temperature is 0.090 Å⁻³, in TiH₂ and Mg₂FeH₆. Liquid hydrogen is 0.042.
That is the clean answer to "why do hydrides need megabars?" Not because pressure makes each proton couple harder (it barely changes , and within one phase compression actually lowers Tc because the force constants stiffen faster), but because pressure packs more protons into the same volume. You can play with the budget below. The point to look for is the gap between the left cluster and the right one.
Start at KPtH₆, the strongest compound in the one-atmosphere census: of 82, three times what a proton in an electron gas manages, but at 0.068 Å⁻³ that buys only = 5.6 eV/Ų, an asymptote of 323 K, and about 160 K at an efficiency of 0.5. Click LaH₁₀: lower , five times the density, inside the requirement band. Then the dashed "what if" button puts KPtH₆'s at LaH₁₀'s density, which gives an asymptote near 730 K. Nothing forbids such a compound. The paper is careful to say exactly that: "A compound with both would meet the single-mode requirement, and nothing we know forbids one." Nobody has found one either.
The census: 4,619 hydrides at one atmosphere
To measure and at scale, the paper reads the Alexandria phonon and electron-phonon release of 11 August 2025 (Cavignac and coauthors, CC BY 4.0), harmonic PBEsol calculations at one atmosphere in 93 files. Of 83,801 records, 56,505 (67%) have imaginary harmonic modes and carry no spectral function; 27,151 compounds have one. Hydrogen is in 39,002 records, of which 6,094 have a spectral function. In 4,619 of those the highest phonon branches are at least 90% hydrogen at every wavevector, so the hydrogen part of separates cleanly. Those are the labelled hydrides.
The headline numbers, which I recomputed from their labels.csv and match to the digits printed: the geometric mean of is 7.2 eV·Å, a fifth of a free proton. 18 of 4,619 exceed the electron-gas value of 36.6, the largest being RbPtH₆, CsPtH₆ and KPtH₆ at 82 to 85. A regression of on has slope 1.41 and = 0.66: hydrogen density alone explains two thirds of the variance. exceeds 1 eV/Ų in 738 compounds, 2 in 25, 3 in 5, and the 4.83 floor in 4. The largest is 5.60, in KPtH₆, with = 2.06 and = 631 K. None reaches 8.7.
I also wanted to know whether the labels themselves were read correctly from Alexandria, since every downstream number depends on them. I downloaded one of the 93 raw files (alexandria_ph_000.json.bz2, 52 MB, 2,375 records), integrated at the 0.030 Ry smearing myself, and compared. All 125 records with a spectral function in that file match labels.csv to within 0.0015% in , and my matches the release's own stored to a median 0.2%. One file of 93 is a spot check, not a full recount, but the extraction is doing what the paper says.
The census says less than "none reaches 300 K"
The paper does not oversell this, and neither should I. The conclusion is conditional on things it lists itself, and two of them are large.
The first is smearing. A DFT electron-phonon calculation samples the Fermi surface with a smearing width, and the release stores ten widths from 0.005 to 0.050 Ry. Over the 27,120 compounds with at both, at 0.005 Ry differs from 0.030 Ry by a standard deviation of 0.31 (I get 0.308 from the CSV). For the five hexahydrides at the top of the census it is worse: their is 2.4 to 3.7 times larger at the narrowest width, and the largest in the census becomes 311 eV·Å instead of 85. At that width all five exceed the single-mode requirement. The paper's own sentence on this is the right one: "Placing the family against the requirement needs a calculation converged in the sampling of the Fermi surface." The headline result, in other words, flips for exactly the compounds that matter, depending on a numerical setting nobody has converged.
The second is what is missing. 84% of hydride records have no spectral function because the harmonic calculation found an imaginary mode, and strong coupling is known to drive phonons towards instability. The compounds most likely to have large are disproportionately the ones the census cannot see.
There is also a quieter dependency the paper flags in its closing section: the release, the largest ambient-pressure survey it cites, and seven of its eleven named candidates all come from one group's harmonic workflow. A systematic error there would move all of them together.
Persistence: the condition calculations skip
The third condition for a useful superconductor is that the phase exists at one atmosphere and stays there. This is where the ambient-pressure hydride programme has gone worst, and the paper's Table 9 is a sobering read. Of eleven hydrides that publications predict above 60 K at ambient pressure, none has been made at, or recovered to, one atmosphere. Two did not form when their metals were heated in hydrogen: Mg₂IrH₆ came out as Mg₂IrH₅ every time, and Mg₂PtH₆ gave Mg₄Pt₃H₆. Two (Li₂AuH₆ and Li₂AgH₆, the top two of the largest survey's hull figure) fall apart in a path-integral simulation that treats the protons as quantum particles: a quarter of Li₂AuH₆'s hydrogen pairs into H₂ molecules. For six there is no test of any kind.
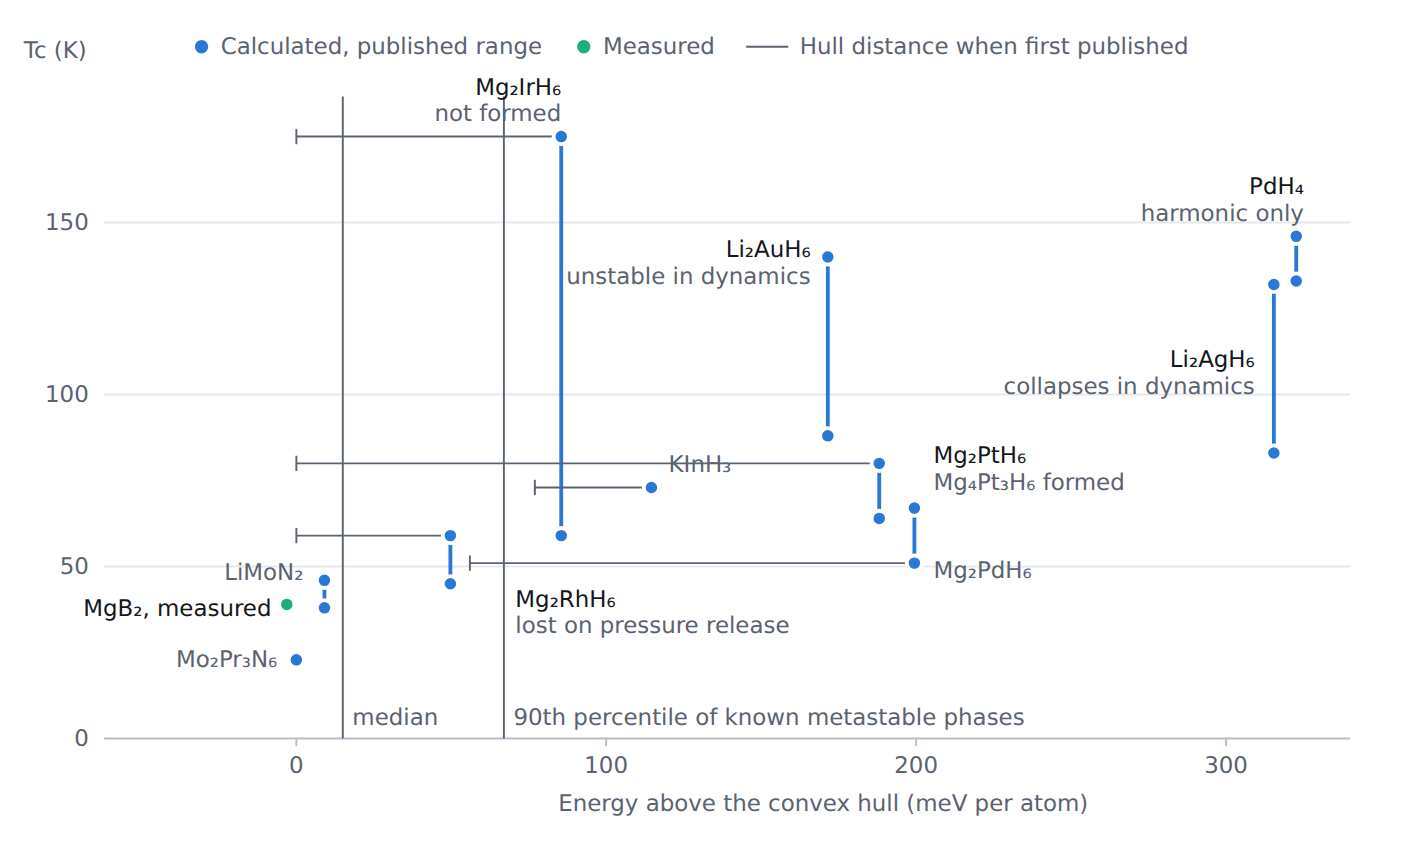
The paper offers a hypothesis I found the most interesting idea in it. A large means the electron energies at the Fermi level shift steeply when hydrogen moves. That same sensitivity is a handle the lattice can use to lower its energy: by pairing hydrogen into molecules (Li₂AuH₆ in simulation), or by changing composition until the electron count closes a shell (Mg₂IrH₆ sits between two insulators, Mg₂IrH₅ and Mg₂IrH₇, one hydrogen away on each side). The five hexahydrides at the top of the census each have a closed-shell insulating neighbour, K₂PtH₆ among them, one alkali atom away, sitting on the convex hull with a gap of 3.1 to 3.8 eV. If that is general, then strong coupling and stability at ambient pressure are not independent knobs. It is labelled a hypothesis, and it is untested.
Put the three conditions together and the paper's verdict is this sentence, which I quote whole because it is the honest version of a launch announcement: "Our credence that a phonon-mediated superconductor with Tc above 300 K exists and can be kept at one atmosphere is about one in a hundred, and one in a thousand is as defensible." For unconventional pairing, cuprate-like, it gives no number at all, because no validated theory predicts Tc from a structure in that class.
The model: roomtsc 0.1
With the target fixed as the Hopfield sum, the model is a natural next step: estimate and from the crystal structure alone, so you can rank thousands of structures before spending a DFT electron-phonon calculation on any of them.
It is two estimators averaged in . One is gradient-boosted trees (scikit-learn's histogram implementation) on 72 hand-built descriptors of the cell: hydrogen density, an from a valence-counting rule, statistics of atomic number, electronegativity, radius, mass, group, row and valence, shortest distances, neighbour counts around hydrogen, space group. The other is a message-passing graph network on the crystal graph: atoms closer than 5 Å are connected, each edge carries its length expanded in 32 Gaussians, four layers of width 96, and a softplus head returns a positive strength for each atom. The compound's and are then assembled by the physics equations rather than learned directly, and , so the network cannot output a negative coupling or an larger than its . It is trained on all 27,151 compounds for and the 4,619 labelled hydrides for , with Huber losses on both.
That design choice is the thing I would steal. Most ML Tc models (more on them below) learn Tc directly, which bundles together the phonons, the coupling and . A target that is phonon-independent by a sum rule and that bounds Tc from above is easier to learn and harder to misread.
Pre-registered tests, a leak, and a failure left in
What makes the model release unusual is the testing. Before training on the full release they deposited the splits, the reference values and the baseline predictions, with a mark: an estimator passes if its mean absolute error in is at most half that of the best of three simple baselines (a constant 36.6, a constant times the density of states, and the training mean). Splits hold out whole structure types, so the model cannot score by recognising an arrangement it has seen. One split also carries an extrapolation requirement: of the held-out hydrides whose label is above anything in training, at least half must be estimated above the training maximum.
Then they found that the first deposit leaked. Structure types had been labelled by Wyckoff letters, which depend on the choice of origin, so the same cubic A₂MH₆ arrangement appeared under two labels (81 compounds under one, 15 under the other) and could sit on both sides of a split. Five held-out compounds also had a second record in training. They wrote a second deposit with site-symmetry labels and one record per compound, re-ran everything, and published both runs plus a script that measures the leak. The companion paper is frank that the second deposit was written with the first results known.
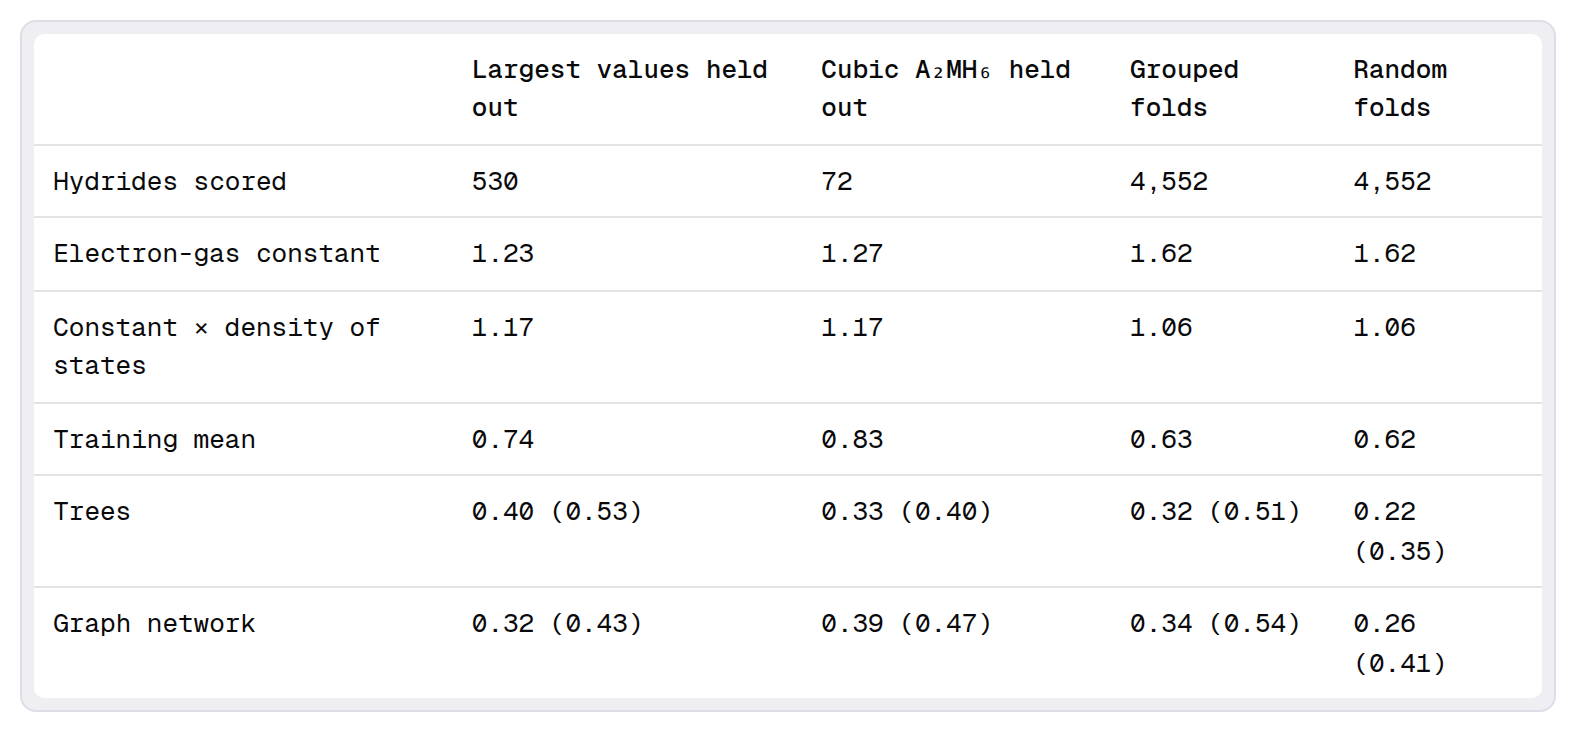
Result: on splits that share no structure type with training, the two estimators' errors are 0.40 to 0.54 of the best baseline's. The graph network meets the mark with the largest values held out (0.43) and the trees miss it (0.53); both meet it on the held-out A₂MH₆ family (0.40 and 0.47); both narrowly miss over grouped folds (0.51 and 0.54). Three of six. An error of about 0.32 to 0.40 in is a factor of 1.37 to 1.49 in , or 17 to 22% in the upper scale of Tc, which is about the same size as the smearing sensitivity of the labels themselves.
And the extrapolation requirement fails outright. Of 23 held-out hydrides with labels above the training maximum of 33.5 eV·Å, the trees place none above it and the graph network places two, where at least twelve were needed. The trees are low on all 23 and the network on 22, by a factor of 2.9 and 2.7 in the geometric mean. The five platinum and nickel hexahydrides, with labels of 63 to 85, were estimated at 12 to 22. Every output for a hydride carries this, in model/predict.py line 129:
flags.append('the estimators failed the test of predicting above their training range (largest training value %.0f eV A); a compound stronger than that would be underestimated' % tr['h'][1])I have read a lot of model cards. I have not often seen the failure written into the inference code.
What the first screen does and does not show
As a first use they ran the released model over the 30,822 unlabelled hydride compounds (mostly the harmonically unstable ones the census could not see). I recomputed the summary from unlabelled_hydrides.csv: the geometric mean of the estimated is 10.7 eV·Å, against 7.2 for the labels; 112 estimates of exceed 2, 3 exceed 3, and none reaches 4.83. The top estimate is a cubic polymorph of KPtH₆ with a small instability (lowest harmonic frequency −16 cm⁻¹) at = 4.76, which at the published efficiencies of 0.35 to 0.58 is an upper scale of 104 to 173 K. That is the green diamond in the landscape above.
My reading is more pessimistic about the screen than the lab's tone and more optimistic about the model. "None reaches the floor" is close to uninformative here, because the model was shown, on held-out data, to compress anything above its training range by a factor of nearly three. A compound with a true of 12 would plausibly come out near 4.5. The lab says this too ("These are estimates and settle nothing about the gap"), and treats the list as an order in which to run direct calculations, which is the right use. As a ranker inside its training range the model is clearly better than a constant: rank correlations with the label of 0.71 to 0.82 on the marked splits. As a detector of the record-breaker it cannot be, and it says so.
One caveat on the pre-registration itself. The deposits are timestamped "by our own clock" and cite commit hashes (08be0a2, a58a0ef), but I found no public repository behind them, so I cannot independently confirm that the splits predate training. The design is right; the receipt is self-issued.
What ML Tc predictors can and cannot do
It helps to set roomtsc 0.1 against the older approach. The classic ML Tc models train on SuperCon, the National Institute for Materials Science's database of measured transition temperatures, about 33,000 entries of which roughly 10,000 are duplicates. Stanev and coauthors (2018) used "the 12,000+ known superconductors" with composition-only features: a classifier for above or below 10 K with about 92% out-of-sample accuracy, and separate regressors for cuprates, iron-based and low-Tc families. Hamidieh's composition model reports an out-of-sample RMSE of 9.5 K.
Those numbers look good, and they answer a narrower question than they appear to. A model trained on measured Tc learns which compositions resemble known superconductors of each family. Meredig and coauthors (2018) tested exactly the case that matters for discovery, extrapolation to materials better than the training set, and concluded that traditional ML metrics overestimate model performance for materials discovery. That is the same failure roomtsc 0.1 measured in itself. The track record matches: the RoomTSC paper counts five superconductors first suggested by a learned model and then made with an identified phase, plus one more, all between 0.8 and 5.4 K, and nine alloys from a generative model at 4.8 to 9.7 K that did not form the predicted structure.
So ML predictors are useful for triage: throwing out structures that will obviously not superconduct, ranking within known families, deciding which DFT calculation to run next. They do not know about physics outside their data, they cannot see a mechanism that is absent from training, and for the cuprates there is no forward theory to train on either. What roomtsc 0.1 adds is a better target and an honest test. It does not escape the extrapolation problem, and nothing trained on today's labels will.
What "AI lets you work on moonshots" means here
The launch post's claim is about method, so it is fair to ask what the AI did.
From the site and the thread I can reconstruct some of it. The footer reads "research, model and site made with Proto", ERP.AI's own product. Asked whether they trained a model or used existing ones, @protosphinx replied that "generic language models help with reading, code and checking. for specialised physics they aren't enough alone", and to someone joking about "you and chatgpt": "not even chatgpt tbh". The lab log shows the tempo. Draft 4 of the paper went up on October 6 and was revised the same day "after a citation audit of every section and a recheck of 1,540 printed values", with about 160 corrections and the reference list growing from 174 to 217. On October 7 came Draft 5 (the full Alexandria census replacing a census of published tables, which had overstated typical threefold), the first deposit at 07:16 UTC, the discovery of the leak, the second deposit at 11:23 UTC, the model release, the companion paper and Draft 6. The equipment list followed on October 8.
That is a lot of careful work for one byline in three days, and the shape of it is telling. Literature synthesis across 217 references, a census of 83,801 records, an Eliashberg solver, a Kohn-Sham calculation of a proton in an electron gas, a graph network, pre-registration bookkeeping, a 10-article wiki: none of it is new physics computation in the expensive sense. Every label comes from Alexandria's DFT runs, done by another group. What AI compresses is the reading, the coding, the checking and the writing, which is most of what a theory-and-data paper costs. That is a real and believable claim. It is the same pattern I saw in the integer-multiplication exponent race and across OpenAI's math release: models collapsing the cost of careful bookkeeping, with the hard verification still done by a person or a checker.
The risk is the mirror image. A machine that can produce 41 careful-sounding pages in a day can also produce 41 subtly wrong ones, and volume makes review harder. What saves this release is that everything is checkable: the data files, the scripts, the solver, the split files. I checked a slice and it held. I could not check how much of the paper's reasoning Proto wrote versus a person, and the site does not say.
What AI does not do is the part the lab exists for. No calculation here converges the electron-phonon coupling of KPtH₆. No sample has been made. The paper's own next steps are converged for the platinum and nickel hexahydrides, hull distances, persistence estimates and a random sample of the unstable records; its milestones below room temperature are a phonon superconductor above MgB₂'s 39 K that persists at one atmosphere, then 77 K. Those are honest targets, and they are where a scrappy lab will either show something or not.
Where I land
I expected hype and found the opposite problem: a launch so hedged it is easy to miss what is good in it. The Hopfield-sum framing is a clear way to turn "is room temperature possible?" into a number you can compute and compare, and the split gives the best one-line answer I know to why hydrides need megabars. The census is the first I have seen across the full Alexandria release, and its numbers recompute. The model picks a target that physics bounds, tests it on held-out structure types, and publishes the failure.
The weaknesses are mostly the ones they list. The census conclusion depends on a smearing width that changes the answer for the top family. The screen of unstable records cannot see past the model's training range. One workflow underlies most of the data. The pre-registration is self-timestamped. And the lab has not yet touched a sample.
If you are deciding whether to follow it: the next drafts will be worth reading for the converged hexahydride calculation alone, because that is the one computation in the paper that could move its own credence.
How I checked
I read the launch post, its thread and replies through the fxtwitter mirror; both drafts on roomtsc.com as PDF and HTML; the model, data, lab and wiki pages; and the scripts on the data page as text (model/predict.py, model/train2.py, model/extract.py, numerics/h_alexandria.py, numerics/eliashberg.py and others). I did not run any of their code. Figures were rendered from the site's own SVGs in a headless browser and flattened onto white; the home-page image is the one attached to the launch post.
I wrote my own linearised isotropic Eliashberg solver for an Einstein mode (, cutoff ) and reproduced the paper's Table 2 coefficients. I recomputed the census statistics (geometric mean and spread of , the counts above 36.6 and above each threshold, the density regression, the top five, the smearing spread, the release's Allen-Dynes and Eliashberg counts) from labels.csv, and the first-use statistics from unlabelled_hydrides.csv. To check the labels against the source I downloaded one of the 93 Alexandria files, integrated myself and compared all 125 records with a spectral function; then deleted it. The 136.5 K constant I checked by hand.
Physics figures I checked against primary sources: BCS (Phys. Rev. 108, 1175), McMillan and Allen-Dynes, MgB₂ 39 K, YBa₂Cu₃O₇ 93 K, Hg-1223 133 K and 164 K at 31 GPa, H₃S 203 K at 155 GPa, LaH₁₀ 250 K at 170 GPa, CaH₆ 215 K at 172 GPa, YH₉ 243 K at 201 GPa, the two retracted Nature papers, the LK-99 preprints and the three refutations cited, and the arXiv abstracts for LaSc₂H₂₄ and the Gao survey. What I could not check: anything that depends on the other 92 Alexandria files beyond what labels.csv reports, the timing of the pre-registration deposits, the Kohn-Sham electron-gas values, and how the work was split between Proto and its author.